
2
Diwali Picks Report | November 2023

3
Diwali Picks Report | November 2023
Navigating Global Uncertainty: India on a Steady Ground
The Indian economy has sustained its growth momentum led by resilient urban
demand and positive macro-economic variables. India’s GDP is expected to grow at
6.3% in FY24 (highest globally) on the back of a resilient demand outlook, easing
inflationary pressures and moderating commodity prices. The momentum is
continuing with both Manufacturing and Services PMI in an expansionary zone as
demand conditions remain strong.
Early signs of capex revival are also visible led by increased capacity utilization,
revival in private capex, stabilization of the supply chain, and increased government
spending. Owing to steady economic growth, the trend in tax collections (16 straight
months of Rs1.4 Lakh Crs in GST collections) is likely to sustain, which should enable
the Government to be closer to its Fiscal Deficit target and maintain its focus on
Capex. Overall, the environment is also conducive for Private investments owing to
lower debt levels and healthy banking metrics.
India has made progress in keeping inflation at manageable levels through policy
measures and aided by lower commodity prices. Currently, Nifty PE is trading at 18.3x
1-Yr forward EPS, which is slightly lower than 5-Year average of 18.9x which is
favorable in our view. We are positive on Capital Goods, Construction, Consumer
Durables, FMCG, Healthcare, and IT. Elevated uncertainty arising from geopolitical
tensions, 2024 elections, and the volatility of crude oil prices constitute key short-
term risks.
Global interest rate hike cycle nears peak; growth expected to revert to trend
level
After nearly two years of high inflation, a sustained downtrend is in progress. The
downtrend was supported by aggressive monetary tightening and cooling of energy
prices. While commodity prices have come off from peaks levels; overall global
growth has remained surprisingly resilient led by strong consumption demand.
However, growth rates in developed countries are expected to revert back to the
long-term trend levels as Covid fiscal stimulus is rolled back and impact of rate
hikes and quantitative tightening plays out. This should curb commodity prices,
thereby supporting Indian companies' profit margins.
India is in a strong position amidst a relatively uncertain global scenario
Overall economic growth is expected to sustain its momentum led by easing
inflationary pressures and resilient demand outlook. The normalization in global
growth is likely to keep oil prices in check, aiding the overall external situation.
Moreover, India is in a comfortable position with manageable CAD (-1.1% in 1QFY24
of GDP) and sufficient forex reserves (US $586 Bn) which should aid in absorbing any
near-term shocks. Further, strong tax collections and rising capacity utilization
levels are expected to drive overall investments. Also, strong corporate balance
sheets and healthy banking metrics should also support private capex revival.
DIIs & Retail have emerged as dominant players; FII flows turned positive
We note that FII’s have turned net buyers in FY24 YTD. After net outflows of ~Rs4.7L
Cr in FY22 & FY23; we have seen an FIIs inflow of Rs0.29L Cr in FY24 (YTD’Sep’23).
However, despite FIIs flows being volatile, the Indian markets have been buoyant
driven by strong SIP flows (+23% CAGR over the last 7 years) and domestic buying.
Additionally, the emergence of direct retail participants has been instrumental in
lowering overall dependence on FIIs.
Top Picks
Company
CMP (₹)
TP (₹)
Capital Goods
AIA Engineering
3,513
4,230
Kirloskar Oil
543
650
Polycab India
4,921
6,350
Ramkrishna Forg.
641
780
Wendt India
12,320
15,480
Construction
H.G. Infra Engg.
894
1,190
Consumer Durables
Blue Star
878
1,130
Cera Sanitary.
8,481
10,740
Safari Inds.
4,140
5,330
Financial Services
CRISIL
4,105
4,850
FMCG
Godfrey Phillips
2,261
2,700
Nestle India
24,239
28,700
Healthcare
Narayana Hrudaya
996
1,260
Information Technology
LTIMindtree
5,061
6,370
Persistent sys
6,162
7,700
Source: Company, Angel Research
Closing price as on 31Oct2023
4
Diwali Picks Report | November 2023
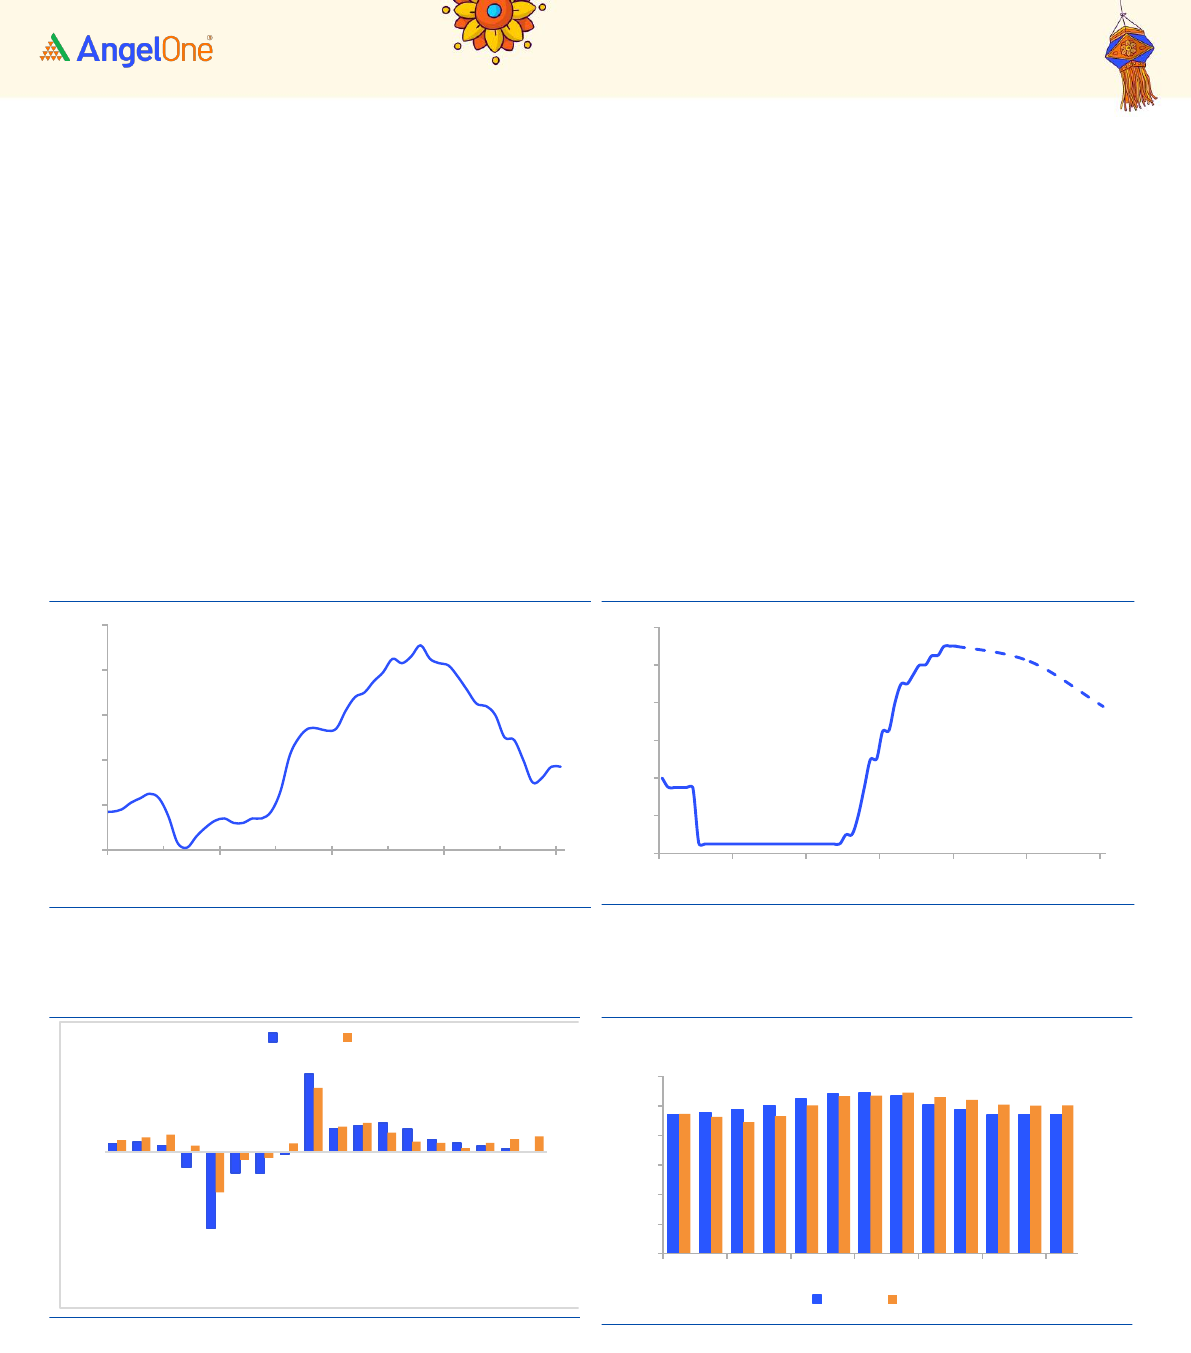
Global interest rate hike cycle nears peak; growth expected to revert to trend
level
After nearly two years of high inflation, a sustained inflation downtrend is now
underway. The downtrend was supported by aggressive monetary tightening and
reversal of causal factors such as supply-side dislocations induced during Covid-19
and surge in energy prices. While commodity prices have come off from peaks
levels; overall global growth has remained surprisingly resilient led by strong
consumption demand. However, growth rates in developed countries are expected
to revert back to the long-term trend levels as Covid fiscal stimulus is rolled back
and impact of rate hikes and quantitative tightening plays out. This should curb
commodity prices, thereby supporting Indian companies' profit margins.
Exhibit 1: US inflation (CPI YoY%) on a downtrend
Source: Bloomberg, Angel Research
Exhibit 2: Fed rate hike cycle is expected to peak out
Source: Bloomberg, Angel Research
Exhibit 3: Real GDP growth moderating towards trend levels
Source: Bloomberg, Angel Research
Exhibit 4: Composite PMIs are closer to contraction zone
Source: Bloomberg, Angel Research
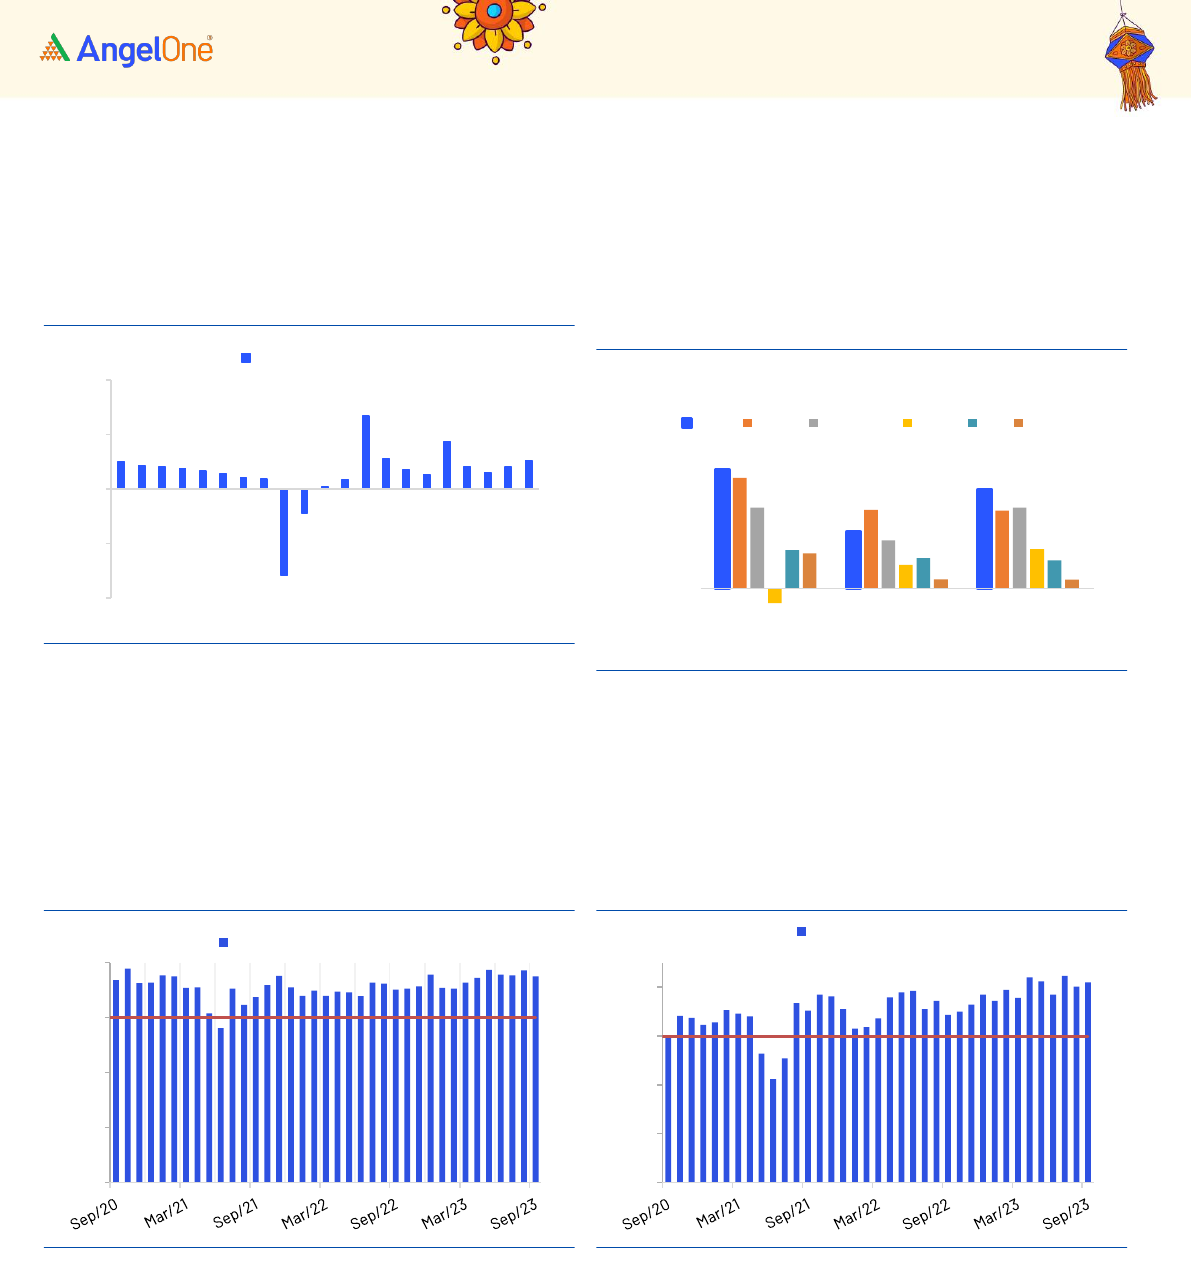
India in a strong position amidst a relatively uncertain global scenario
India continued to be the world’s fastest growing economy amongst the major
countries with real GDP growth of 7% and 7.8% in FY23 and Q1 FY24 respectively. A
sustained recovery in discretionary spending, restoration of consumer confidence,
high festival season spending after two consecutive years of COVID-19 induced
isolation and the government’s thrust on capex provided impetus to the growth
momentum. The index of supply chain pressure for India remains below its
2.3
0.1
9.1
3.7
0
2
4
6
8
10
Sep/19
Sep/20
Sep/21
Sep/22
Sep/23
(%)
1.75
0.25
0.5
5.5
5.1
3.9
0
1
2
3
4
5
6
Sep/19
Sep/20
Sep/21
Sep/22
Sep/23
Sep/24
Sep/25
(%)
(14.2)
14.5
5.4
0.5
(7.5)
11.9
3.6
2.9
-20
-15
-10
-5
0
5
10
15
20
Q1 FY20
Q4 FY20
Q4 FY21
Q4 FY22
Q2 FY24
Europe
USA
47.1
54.4
47.2
47.3
53.5
50.2
0
10
20
30
40
50
60
Oct/22
Dec/22
Feb/23
Apr/23
Jun/23
Aug/23
Oct/23
US Europe Composite PMI
Europe
USA
5
Diwali Picks Report | November 2023
historical average, supporting growth impulses. Growth in GDP figures is expected
to be sustained amid positive business sentiments backed by robust demand
conditions.
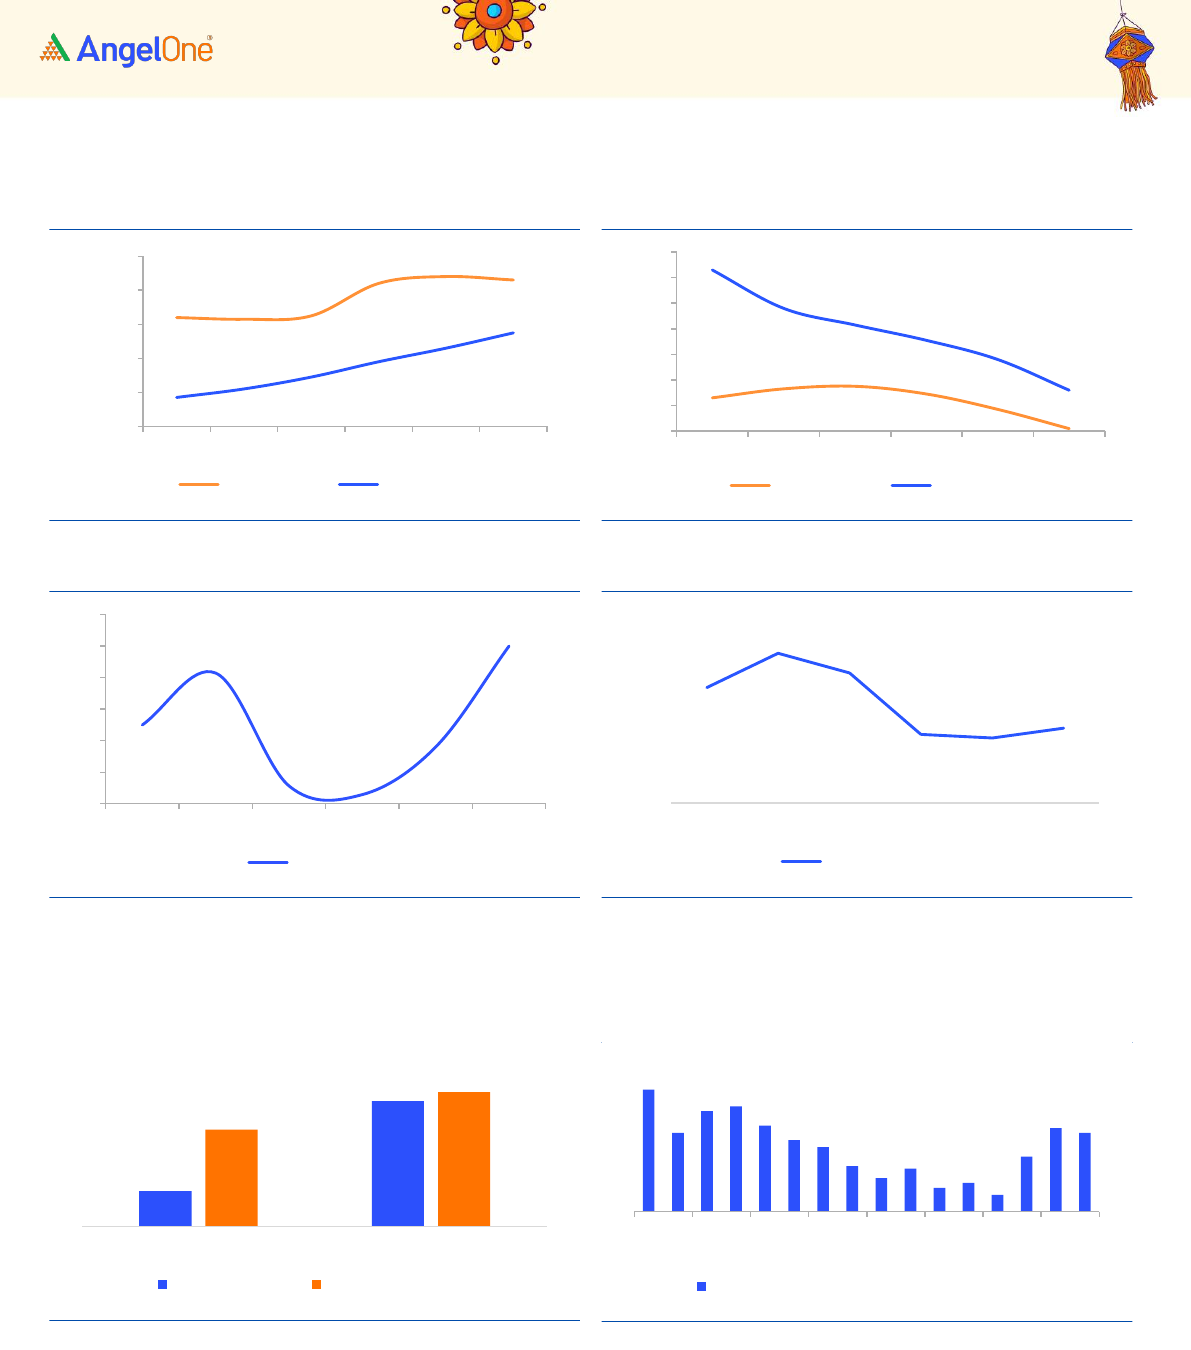
Exhibit 5: Stable growth rates amid inflationary pressures
Source: Bloomberg, Angel Research
Exhibit 6: India is expected to outperform all major
economies
Source: Bloomberg, Angel Research
A positive trend in most of the high-frequency indicators provides reassurance on
the growth momentum. The PMI for the manufacturing sector has remained in the
expansionary zone for almost three years now and the output prospects are
assessed to be strong. Services recorded their sharpest increase in over 13 years,
led by robust demand and new business gains.
Exhibit 7: Manufacturing has maintained growth
Source: Bloomberg, Angel Research
Exhibit 8: Services momentum strengthening
Source: Bloomberg, Angel Research
GST collections are strong as they are recording steady growth with average
monthly collections during Apr-Aug’23 stood at INR 1.66 Lakh crore, up from INR 1.49
lakh Crore same period last year. This will further encourage the government to
maintain its focus on capex. E-way bill volumes also registered a healthy expansion,
indicating robust trade activity.
-23.8
20.1
13.1
6.2
4.5
6.1
7.8
-30.0
-15.0
0.0
15.0
30.0
Q1FY19
Q1FY20
Q1FY21
Q1FY22
Q1FY23
Q1FY24
(%)
India Real GDP YoY
7.4
3.5
6.2
6.9
4.9
4.9
5.0
3.0
5.1
-0.9
1.5
2.5
2.4
1.9
1.8
2.2
0.6
0.6
-2.0
0.0
2.0
4.0
6.0
8.0
CY15-CY18
CY19-CY22
CY23-24E
(CAGR,%)
Real GDP average growth
India
China
Indonesia
Brazil
US
UK
57.5
20.0
30.0
40.0
50.0
60.0
Indian Manufacturing PMI
60.1
20.0
30.0
40.0
50.0
60.0
Indian Service PMI
6
Diwali Picks Report | November 2023
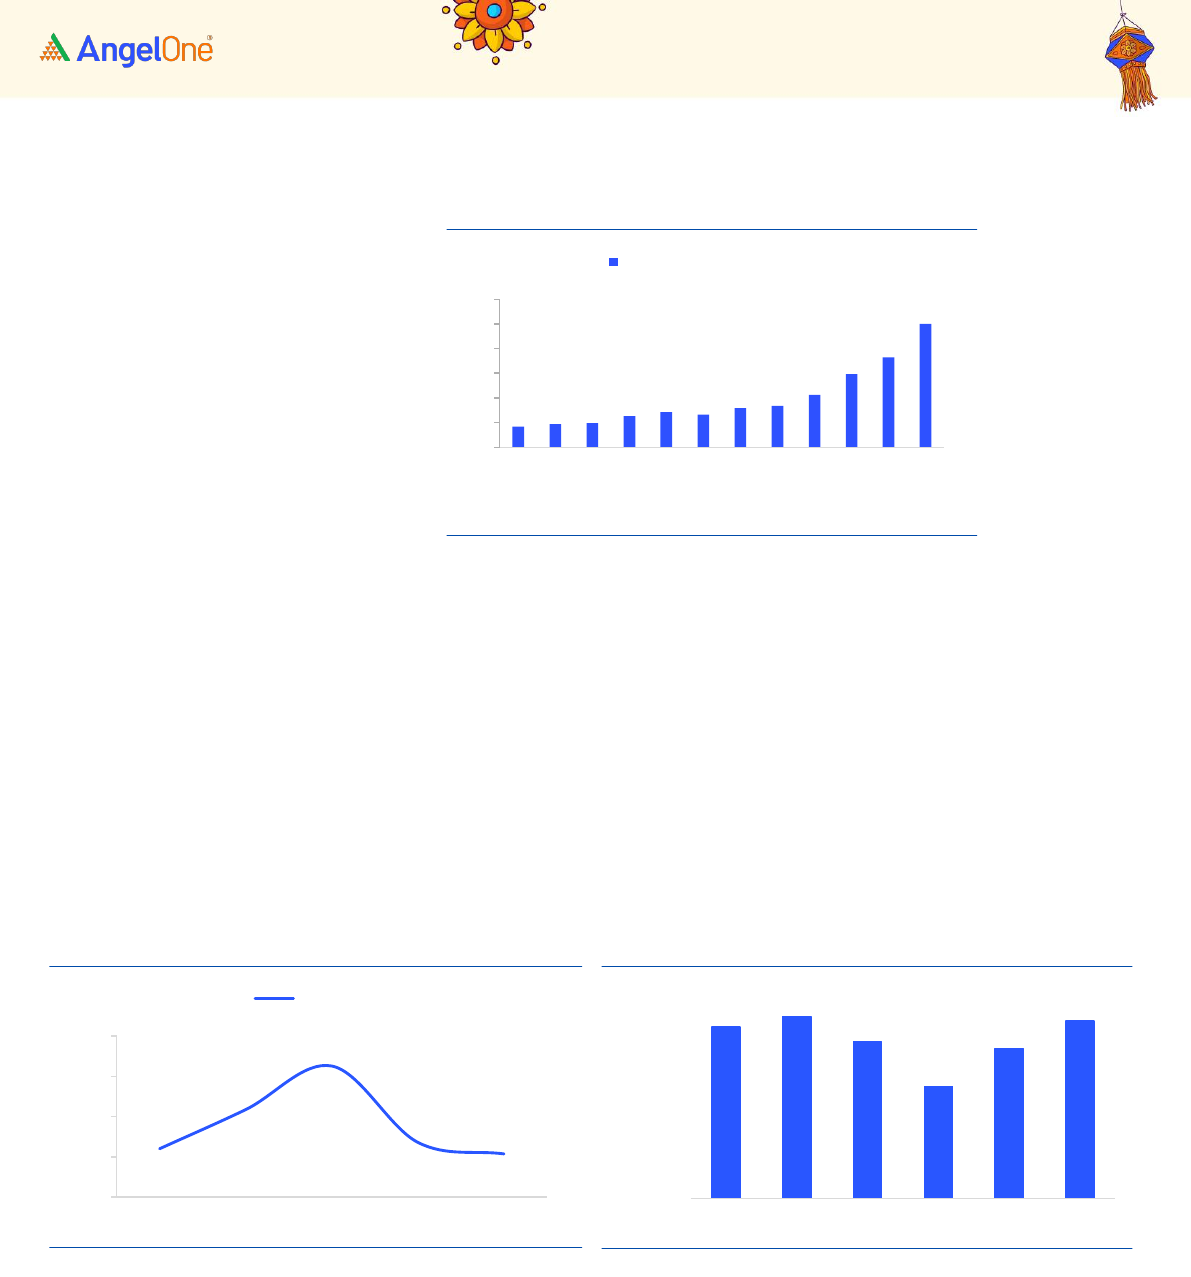
Exhibit 9: GST collection to sustain on broader growth
Source: GSTN, Angel Research
Exhibit 10: E-way data points to better freight availability
Source: GSTN, Angel Research
India’s aggregate demand indicates positive momentum. Among urban demand
indicators, passenger vehicle sales have reached all-time high levels in F23, credit
card spending and UPI transactions are increasing at a healthy rate and domestic
aviation traffic showing smart recovery and nearing pre covid levels. In FY23, the
UPI platform processed a total of 8,375 crore of transactions aggregating to Rs. 139
Lakh crore, compared with 4,597 crore of transactions worth Rs. 84 Lakh crore in
FY22. Further, total credit card spending in FY23 surged by 47.3%, surpassing the
30.1% rise in transaction volume. This suggests a notable increase in spending per
transaction.
Exhibit 11: Domestic aviation traffic nearing previous high
Source: DGCA, Angel Research
Exhibit 12: Passenger vehicle to corroborate urban demand
Source: Angel Research
162.71
-
50
100
150
200
Sep-20
Dec-20
Mar-21
Jun-21
Sep-21
Dec-21
Mar-22
Jun-22
Sep-22
Dec-22
Mar-23
Jun-23
Sep-23
GST Collection Rs. '000 Cr
91.76
-
20
40
60
80
100
Aug-20
Dec-20
Apr-21
Aug-21
Dec-21
Apr-22
Aug-22
Dec-22
Apr-23
Aug-23
Eway Bill generations (mns)
104
124
142
54
85
136
-
50
100
150
FY18
FY19
FY20
FY21
FY22
FY23
(No of Pax in mn)
Domestic Air Traffic
Pre covid level
32.9
33.8
27.7
27.1
30.7
38.9
-
10.0
20.0
30.0
40.0
50.0
FY18
FY19
FY20
FY21
FY22
FY23
Nos in Lacs
Passenger Vehicle

7
Diwali Picks Report | November 2023
Exhibit 13: UPI Transactions on consistent uptrend
Source: DGCA, Angel Research
Exhibit 14: Credit card spends on rise
Source: Angel Research
India‘s capex cycle to pick pace
Investments and consumption are the major drivers of India’s growth story. After
experiencing a slowdown in investment since 2013-14, early signs of revival of the
capex cycle are visible since 2021-22. Investment activity gained steam on the back
of government capital expenditure, rising business optimism, and a revival in
private capex in certain key sectors. Traction in construction activity is likely to be
sustained as reflected in steady expansion in its proximate indicators: Steel
consumption and cement production.
A few of the favorable government policies that are likely to promote capex and
infrastructure development in India are:
1. Production linked Incentive Scheme worth Rs. 2 Lac Cr across 14 sectors to
promote domestic manufacturing and exports
2. National Infrastructure Pipeline with a projected infrastructure of around
Rs. 111 Lac Cr during FY20-25 to provide high-quality infrastructure across
the country
3. National Monetization Pipeline to monetize Rs. 6 Lac Cr worth of
government assets from FY22-25 to fund new infrastructure projects
4. PM Gati Shakti to provide multi nodal connectivity infrastructure to various
economic zones
5. In order to boost exports, India has signed 13 Regional Trade Agreements
(RTAs) /Free Trade Agreements (FTAs) with various countries/regions such
as Singapore, Malaysia, Thailand, Japan, Sri Lanka, Mauritius, UAE,
Australia etc. and is also in advance talks with the UK
Further in line with various policies, the government in the Union Budget 2023-24,
budgeted capital expenditure increased by ~37% from Rs. 7.3 Lac Cr in FY23 to Rs.
10 Lac Cr in FY24 (60% is expected to be utilized by Nov’23).
-
2.0
4.0
6.0
8.0
10.0
12.0
14.0
16.0
18.0
Sep-20
Dec-20
Mar-21
Jun-21
Sep-21
Dec-21
Mar-22
Jun-22
Sep-22
Dec-22
Mar-23
Jun-23
Sep-23
UPI Transactions in Value (Rs.Lakh Cr)
4.6
6.0
7.3
6.3
9.7
14.3
FY18
FY19
FY20
FY21
FY22
FY23
Credit Card Spends (Rs. Lac Crores)
8
Diwali Picks Report | November 2023
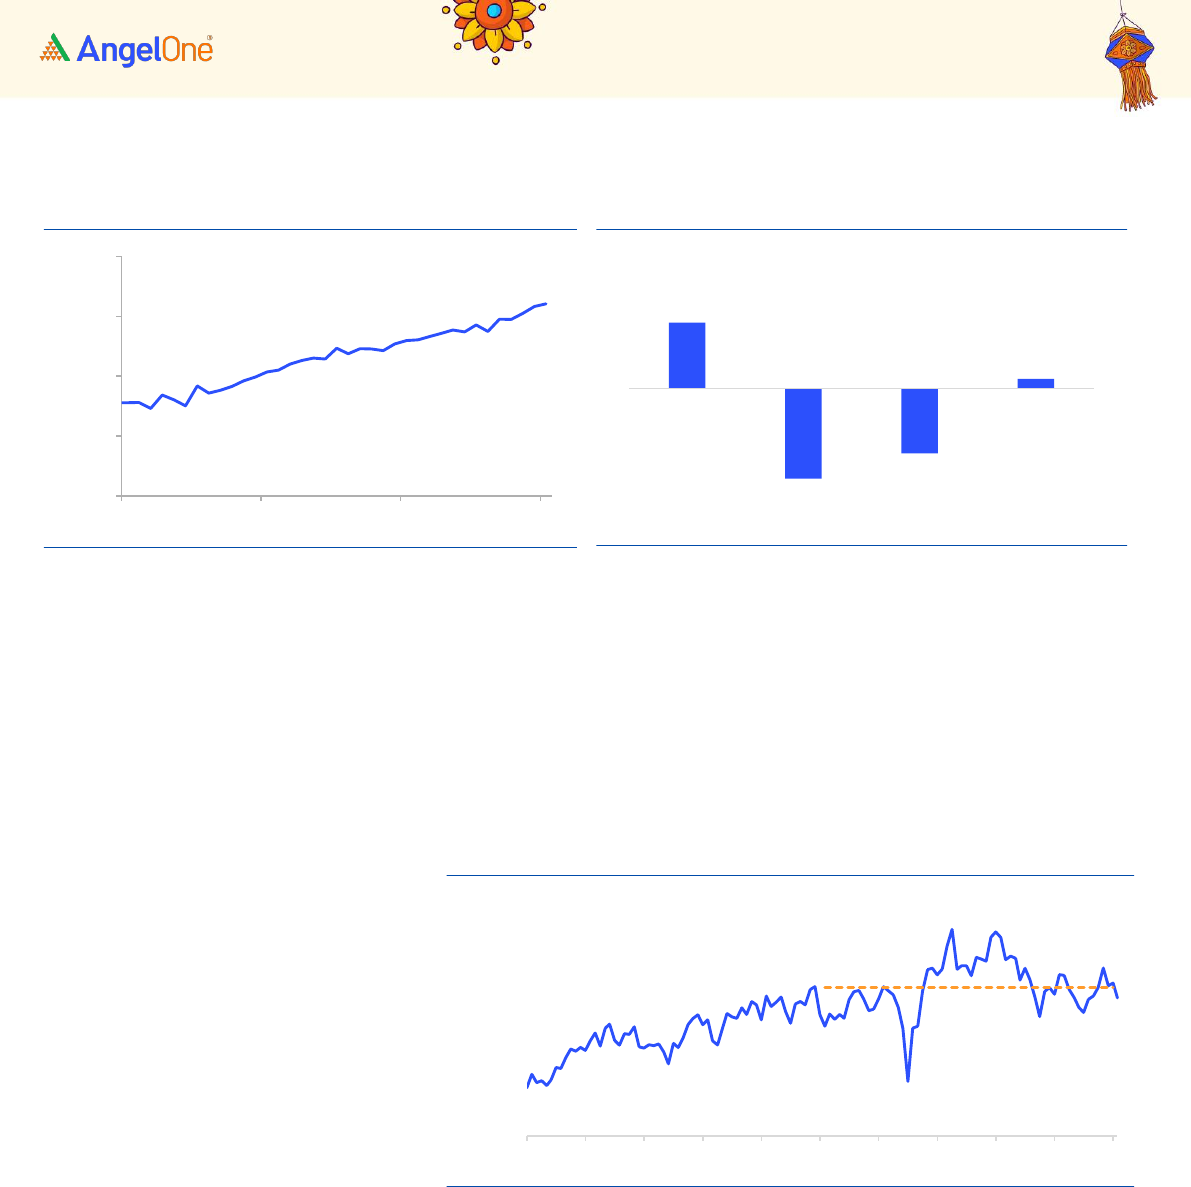
Exhibit 15: Govt Capital expenditure increased by ~37%
Source: Budget Documents, Angel Research
This is resulting in crowding effect which is encouraging private capex. Corporate
India finds itself in a favorable position for investment, propelled by high capacity
utilization, robust balance sheets, clear demand visibility, and optimistic
expectations for earnings growth. Capacity utilization in the manufacturing sector
at 76.3% in Q4FY23 which is above the average of 70.6% (6 Years). Additionally,
corporate India has significantly improved its debt-to-equity ratio reducing from
1.6x in FY21 to 0.5x in FY23, as a result, they now possess a stronger balance sheet,
enabling them to embark on capital expenditure. Given the combination of higher
capacity utilization, reduced leverage on their balance sheets, strong demand
visibility, and government support it is imminent that corporate India will pursue
capital expenditures.
Exhibit 16: Corporate India Debt to Equity
Source: Budget Documents, Angel Research
Exhibit 17: Manufacturing Capacity Utilization
Source: RBI, Angel Research
SCB’s credit growth has been accelerating since early 2022, led by both public and
private sector banks recording a 15.0% y-o-y growth in FY23. The strength of loan
demand was reflected in the rising volume of new loans extended by SCBs.
Simultaneously, the financial health of banks improved with better asset quality and
capital ratios, thus assuring adequate liquidity to meet the credit needs of the
growing economy.
1.7
7.3
10.0
0
2
4
6
8
10
12
FY13
FY14
FY15
FY16
FY17
FY18
FY19
FY20
FY21
FY22
FY23RE
FY24BE
Capital Expenditure (in Lk Cr)
0.6
1.1
1.6
0.7
0.5
-
0.5
1.0
1.5
2.0
FY19
FY20
FY21
FY22
FY23
Debt/Equity
73
75
70
62
69
74
40
45
50
55
60
65
70
75
80
FY18
FY19
FY20
FY21
FY22
FY23
(%)
9
Diwali Picks Report | November 2023
Exhibit 18: Improvement in Capital Adequacy Ratio
Source: RBI, Angel Research
Exhibit 19: Bank’s asset quality has been improving
Source: RBI, Angel Research
Exhibit 20: Increase in credit growth
Source: RBI, Capitaline, Angel Research
Exhibit 21: CD ratio shows headroom for lending
Source: RBI, Angel Research
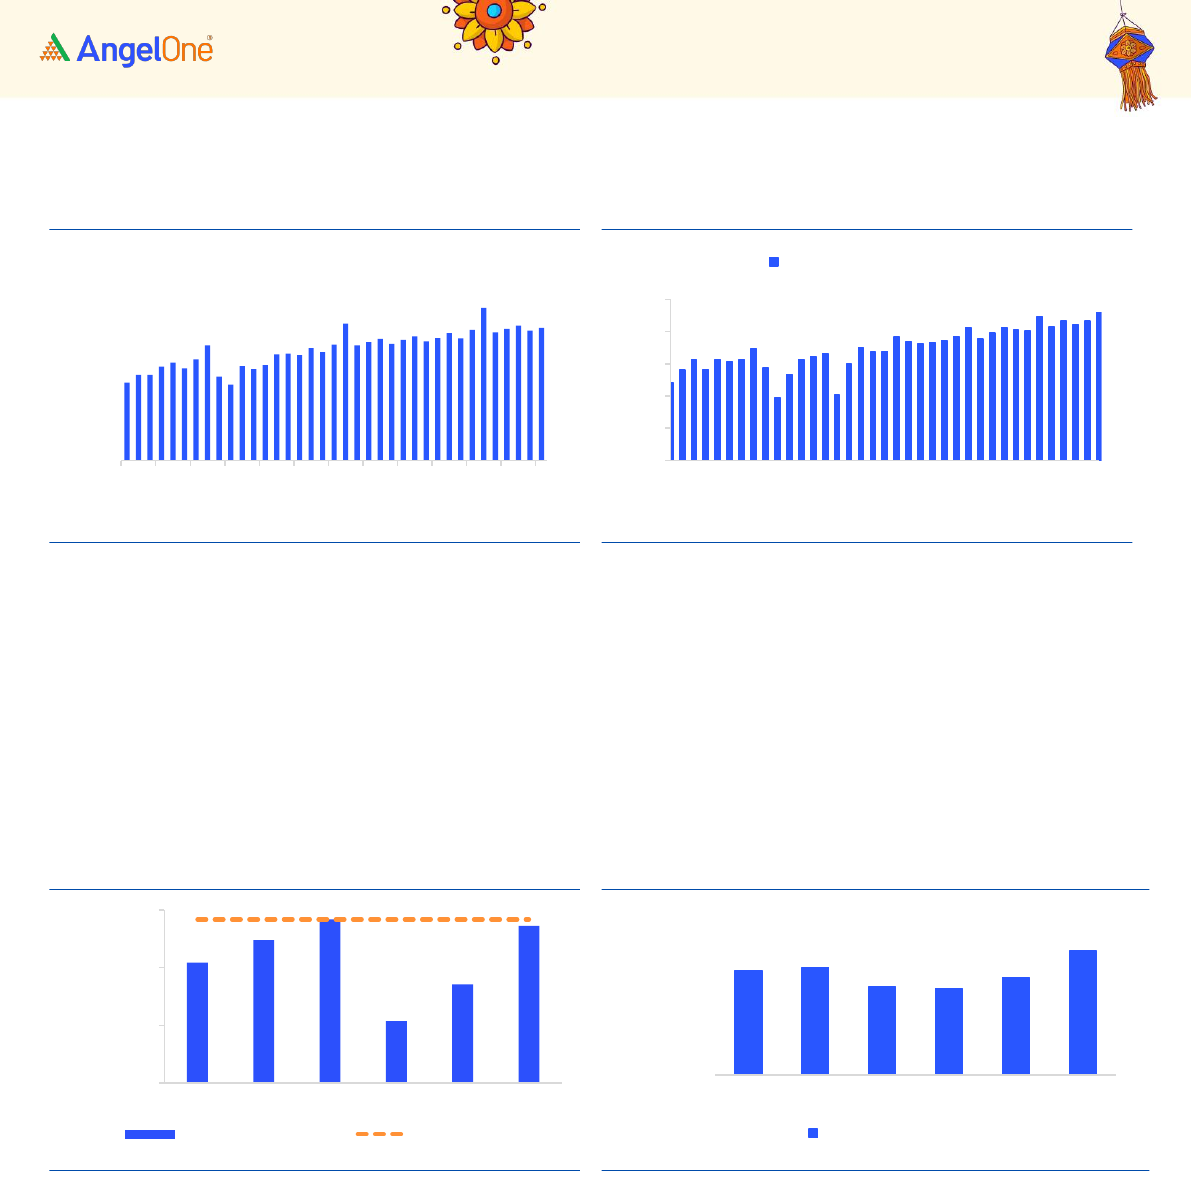
Considering the robust growth outlook, Nifty and Bank Nifty earnings are
expected to grow by 15.8% & 17.0% from FY23-FY25E respectively.
Exhibit 22: Nifty & Bank Nifty robust growth expectations
Source: RBI, Angel Research
Exhibit 23: Corporate profit to GDP stable with room to rise
Source: RBI, Angel Research
16.4
16.3
16.5
18.4
18.8
18.6
11.7
12.2
12.9
13.8
14.6
15.5
10
12
14
16
18
20
FY18
FY19
FY20
FY21
FY22
FY23
(%)
Private banks
PSU Banks
4.6
5.3
5.5
4.9
3.7
2.2
14.6
11.6
10.3
9.1
7.6
5.2
2
4
6
8
10
12
14
16
FY18
FY19
FY20
FY21
FY22
FY23
Gross NPA (%)
Private Banks
PSU Banks
10.0%
13.3%
6.1%
5.6%
8.6%
15.0%
5%
7%
9%
11%
13%
15%
17%
FY18
FY19
FY20
FY21
FY22
FY23
Credit Growth
75.5%
77.7%
72.4%
72.9%
68%
70%
72%
74%
76%
78%
80%
FY18
FY19
FY20
FY21
FY22
FY23
Credit to Deposit %
4.4%
15.8%
12.2%
17.0%
FY13-23
FY23-25E
Nifty EPS (CAGR)
Bank Nifty EPS (CAGR)
6.1
5.4
4.0
2.8
1.7
3.3
4.5
4.3
FY08
FY09
FY10
FY11
FY12
FY13
FY14
FY15
FY16
FY17
FY18
FY19
FY20
FY21
FY22
FY23
Corporate profits of listed companies (% of GDP)
10
Diwali Picks Report | November 2023
Inflation broadly at manageable levels
On the inflationary pressures, India has made significant progress towards
controlling inflation. While monetary transmission is still underway, India’s headline
inflation is now within an upper target range of 6%, and the MPC remains committed
to align India’s inflation to the 4% target. Elevated uncertainty arising from
geopolitical tensions and volatility of crude oil prices constitutes an upside risk to
inflation target.
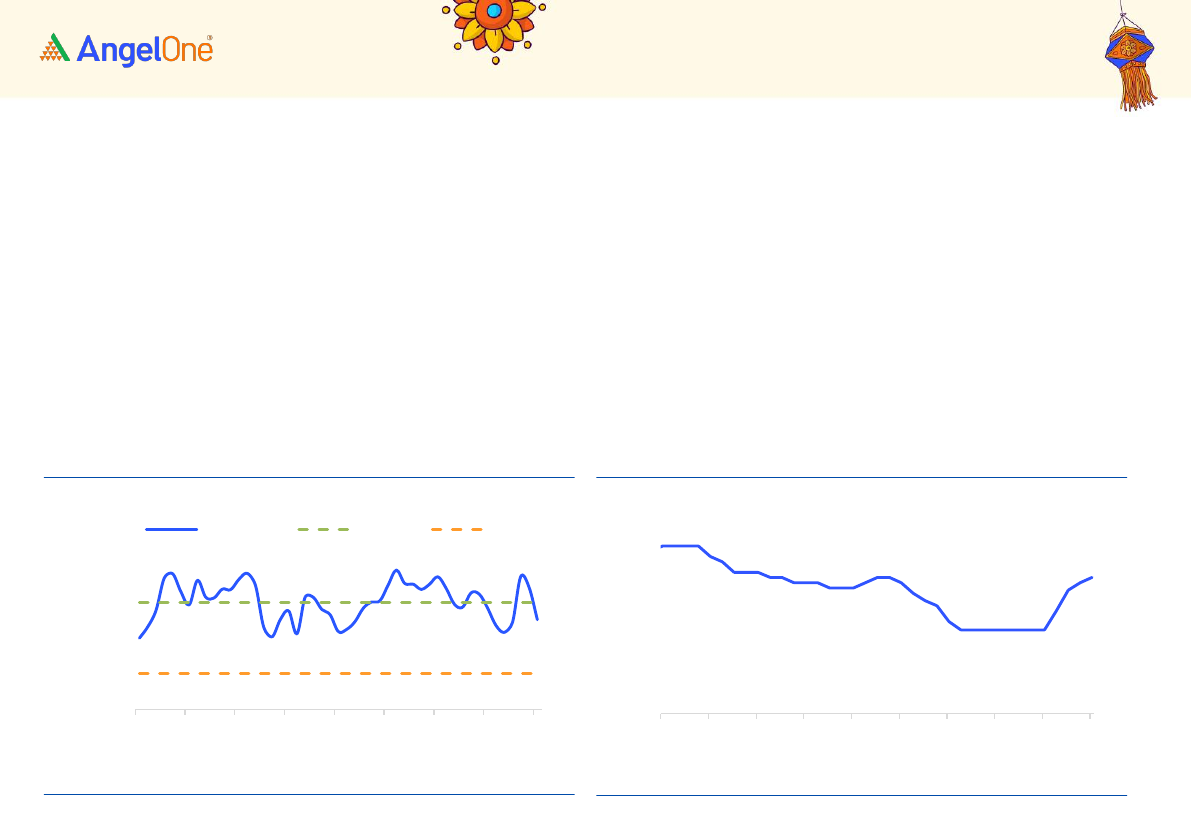
Exhibit 24: India Inflation is now within RBI’s target range
Source: Bloomberg, Angel Research
Exhibit 25: Moderation in rate hikes by RBI
Source: Bloomberg, Angel Research
DIIs & Retail have emerged as dominant players; FII outflows turned positive
The Indian markets have demonstrated remarkable resilience in the face of volatile
FII flows, unlike previous instances of FII selling. This resilience is attributed to the
robustness of domestic institutions (including Mutual Funds) and a steadily
expanding base of retail investors. We note that FIIs have turned net buyers in FY24
YTD. After net outflows of ~Rs4.7L Cr in FY22 & FY23; we have seen an FIIs inflow of
Rs.0.29L Cr in FY24 (YTD’Sep’23). However, despite FIIs flows being volatile, the
Indian markets have been buoyant driven by strong SIP flows (+23% CAGR over the
last 7 years) and domestic buying. Additionally, the emergence of direct retail
participants has been instrumental in lowering overall dependence on FIIs.
7.6
7.6
4.1
4.2
6.3
4.5
7.8
7.4
6.4
4.3
7.4
5.0
-
1.0
2.0
3.0
4.0
5.0
6.0
7.0
8.0
9.0
Sep/19
Mar/20
Sep/20
Mar/21
Sep/21
Mar/22
Sep/22
Mar/23
Sep/23
(%)
India CPI % YoY
Upper Band
Lower Band
8.0
7.5
6.8
6.5
6.0
6.5
4.0
4.0
6.5
0
1
2
3
4
5
6
7
8
9
10
Mar/14
Mar/15
Mar/16
Mar/17
Mar/18
Mar/19
Mar/20
Mar/21
Mar/22
Mar/23
%
11
Diwali Picks Report | November 2023
Exhibit 26: MFs supported by strong SIP flows
Source: Bloomberg, Angel Research
Exhibit 27: FII flows have turned positive
Source: Bloomberg, Angel Research. FY24 is till Sep 2023
Nifty PE trading near its 5-year average
Currently, the Nifty PE is trading at 18.3x its 1-Yr forward EPS, which is slightly lower
than 5-Year average of 18.9x. We believe that valuations are reasonable given the
current inflationary environment which is leading to aggressive monetary
tightening. We are positive on Capital Goods, Construction, Consumer Durables,
FMCG, Healthcare and IT. Elevated uncertainty arising from geopolitical tensions,
2024 elections and the volatility of crude oil prices constitute key short-term risks.
Exhibit 28: Nifty 1 Year Forward PE is trading at reasonable levels
Source: Bloomberg, Angel Research
8,819
12,140
16,042
0
5,000
10,000
15,000
20,000
Sep-20
Sep-21
Sep-22
Sep-23
SIP Inflow (Rs. Cr)
200,563
(275,348)
(198,639)
29,039
FY21
FY22
FY23
FYTD24
FII Inflow / (Outlflow) in Rs. Cr
18.3
18.9
10.0
12.0
14.0
16.0
18.0
20.0
22.0
24.0
Oct/13
Oct/14
Oct/15
Oct/16
Oct/17
Oct/18
Oct/19
Oct/20
Oct/21
Oct/22
Oct/23

12
Diwali Picks Report | November 2023
Diwali Picks
13
Diwali Picks Report | November 2023
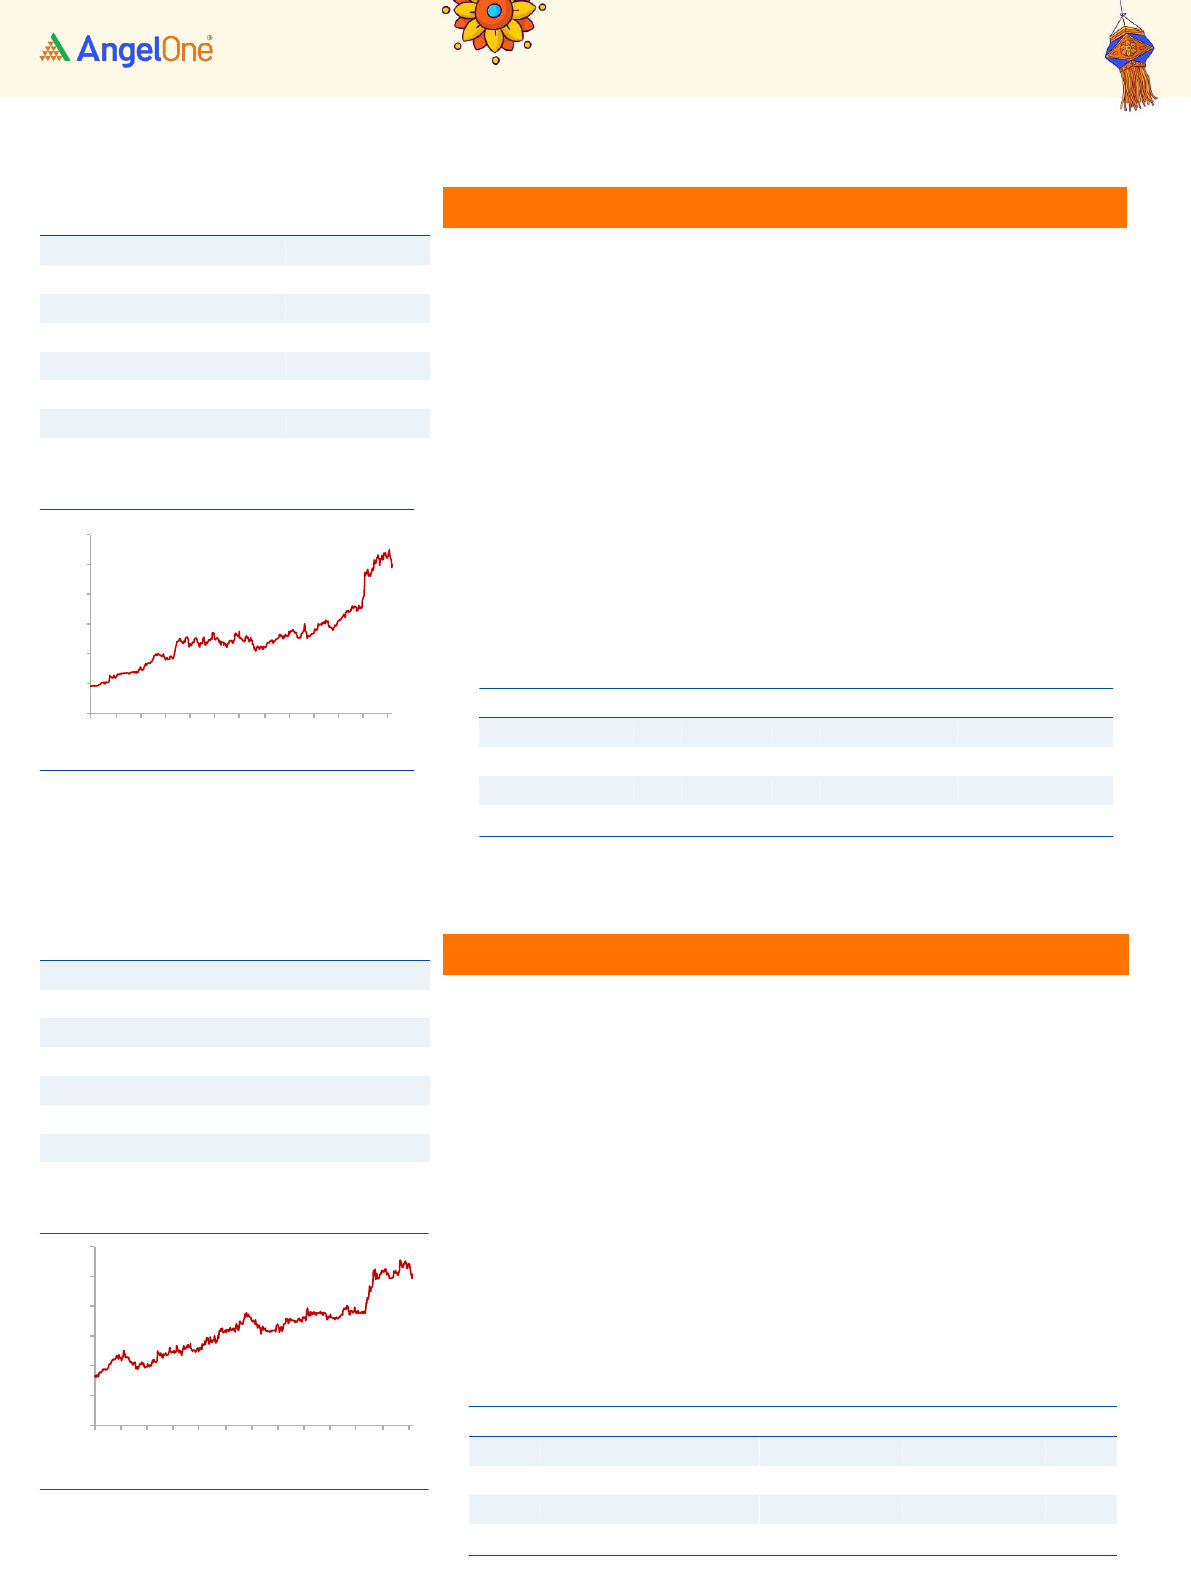
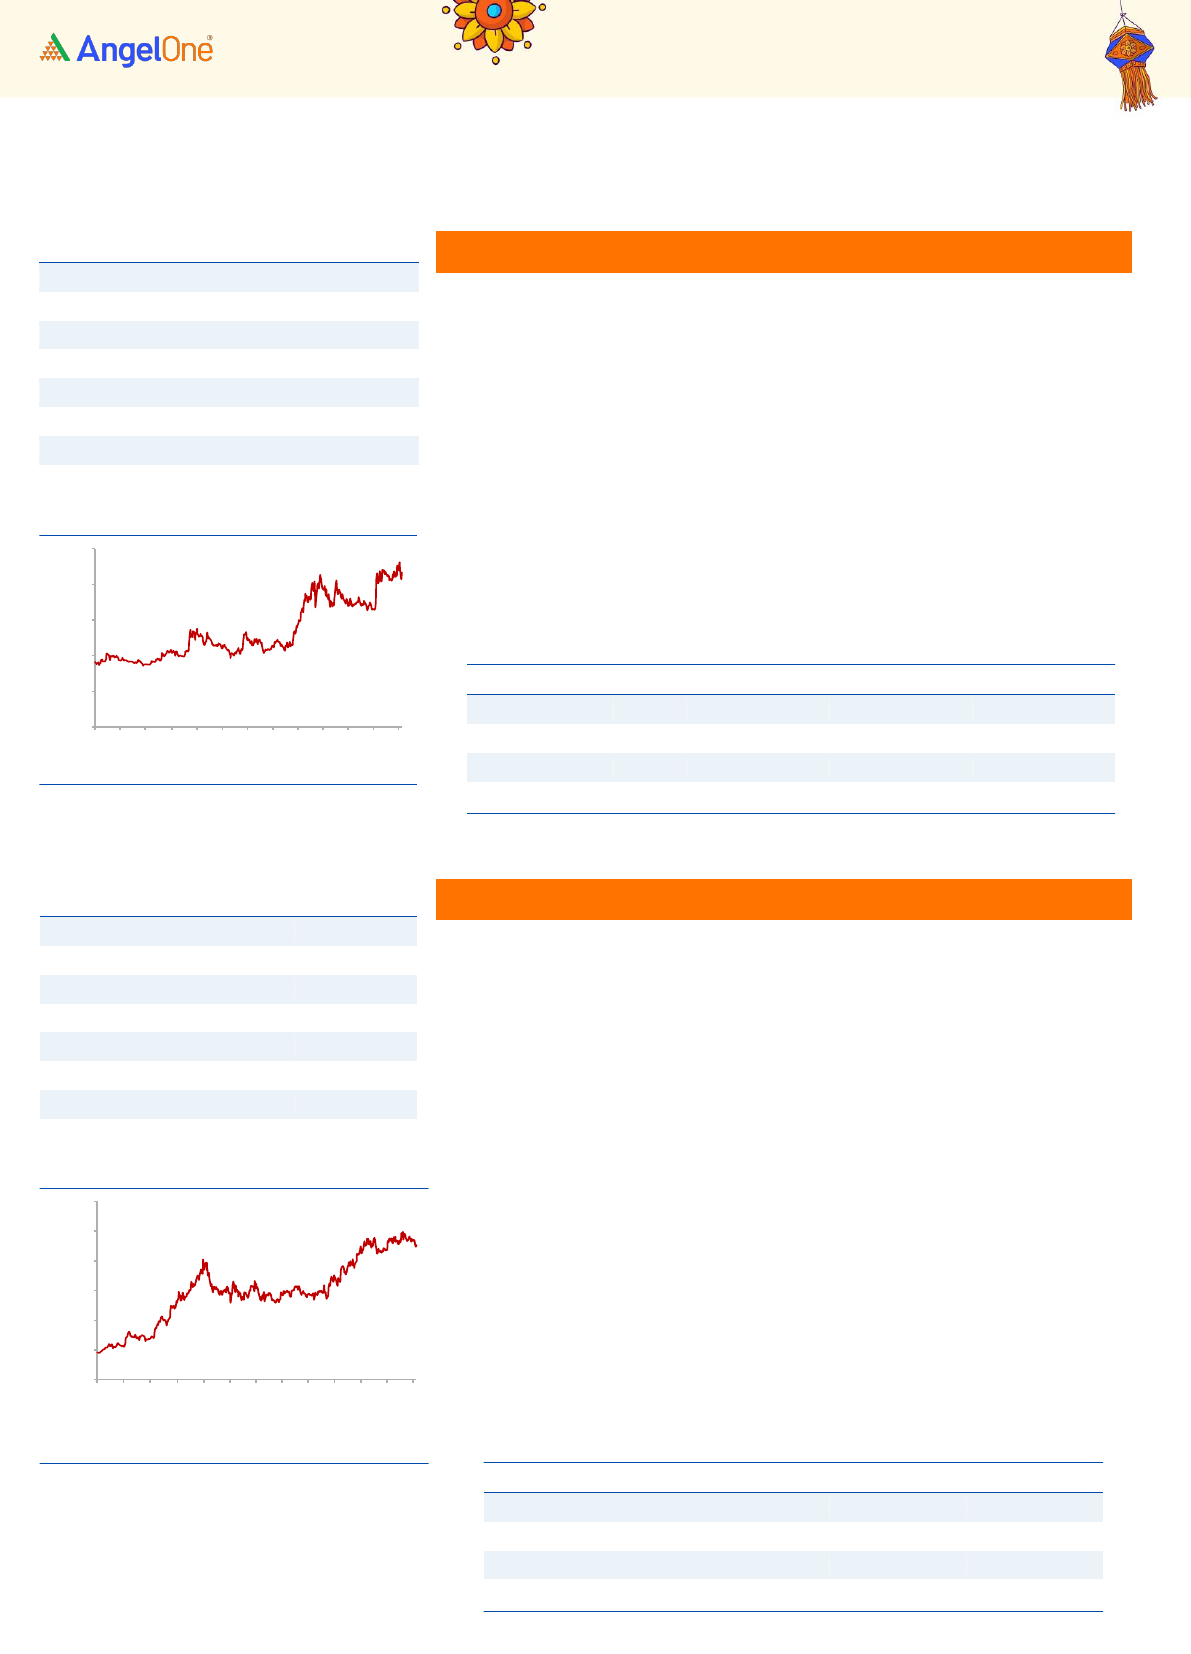
Polycab India
Polycab India Ltd is one of the leading manufacturers of wires and cables in
India. With a robust brand presence, the company boasts an extensive array
of products for retail and industrial use. Polycab is strategically broadening
its footprint in the rapidly expanding FMEG segment, dealing in products like
Fans, Switches, Switchgear, LED Lights and Luminaries, Solar Inverters and
Pumps.
In Q2FY24, revenue rose by 26.5% on a YoY basis to Rs 4,218 Crores and net
profit rose by 58.9% on a YoY basis to Rs 430 Crores. Strong growth was
driven by healthy volume growth in the Cables & Wires segment.
With a robust brand presence and surging demand in the wire and cable
industry, the company is expected to benefit from the same. Anticipated
strong traction in the domestic Cables & Wires segment, driven by
government expenditure and real estate off-take, reinforces this growth
outlook. In the FMEG segment, a focus on premiumization and margin
improvement is likely to support growth.
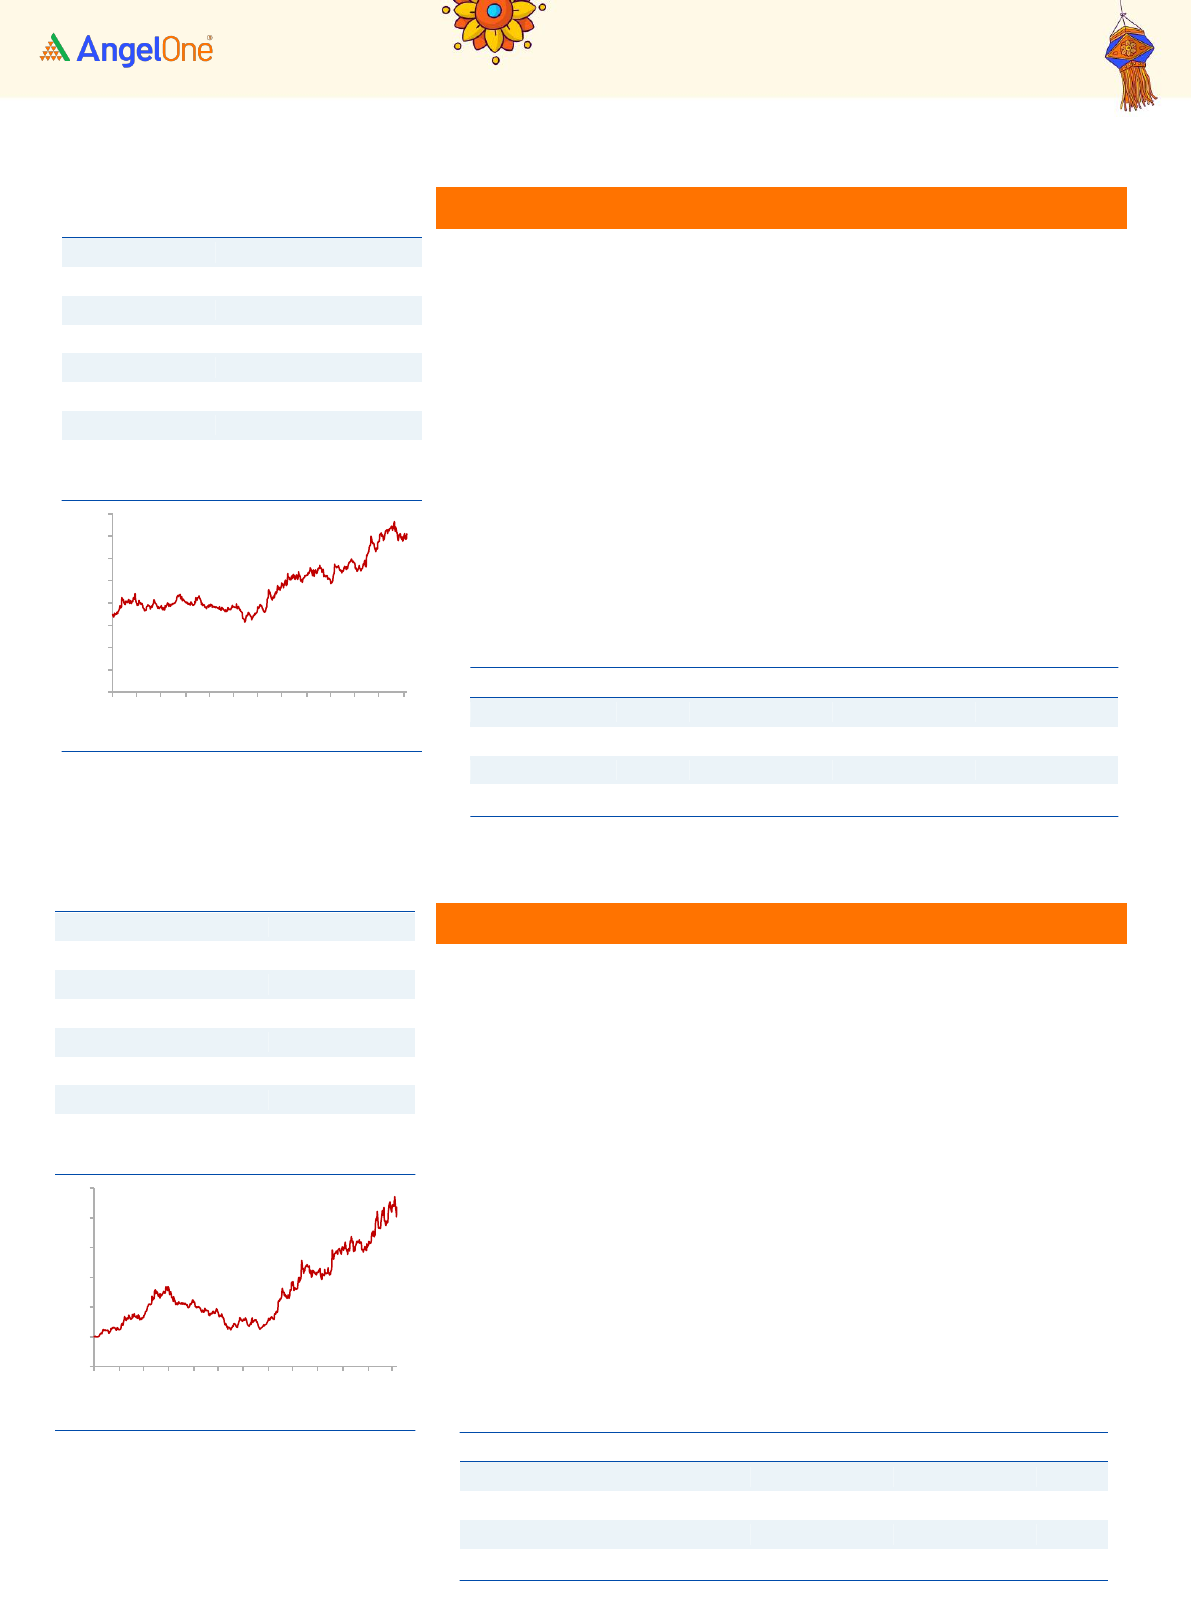
Narayana Hrudayalaya
Narayana Hrudayalaya Ltd (NH) is engaged in providing healthcare services. It
has a network of 45 healthcare facilities including multispecialty, and super
specialty hospitals spread across India.
In Q1 FY24, revenue rose by 19.3% on a YoY basis to Rs 1,233 Crores and net
profit rose by 65.8% on a YoY basis to Rs 184 Crores. Growth in profitability
supported by improvement in margins
NH is a well-established healthcare service provider that has shown double
digit topline growth in the last 5-10 years along with margin improvement. As
the newer hospitals mature, there is scope for further margin improvement.
The company plans to do a capex of Rs. 1100 Cr (~30% of FY23 Gross Block)
and plans to focus on its core and high-performing regions such as
Bangalore, Kolkata, and Cayman, which is likely to enhance growth visibility.
More focus will be on the fastest payback capacity like faster MRIs, and
adding new beds. All of this is likely to support future growth
Stock Info
CMP
4,921
TP
6350
Upside
29%
Sector
Capital Goods
Market Cap (`cr)
74,720
Beta
0.9
52 Week High / Low
5493/2500
3-Year-Chart
-
1,000
2,000
3,000
4,000
5,000
6,000
Oct-20
Jan-21
Apr-21
Jul-21
Oct-21
Jan-22
Apr-22
Jul-22
Oct-22
Jan-23
Apr-23
Jul-23
Oct-23
Source: Company, Angel Research
Stock Info
CMP
996
TP
1260
Upside
27%
Sector
Healthcare
Market Cap (`cr)
20,790
Beta
0.4
52 Week High / Low
1135/705
3-Year-Chart
-
200
400
600
800
1,000
1,200
Oct-20
Jan-21
Apr-21
Jul-21
Oct-21
Jan-22
Apr-22
Jul-22
Oct-22
Jan-23
Apr-23
Jul-23
Oct-23
Source: Company, Angel Research
Key Financials
Y/E
Sales
PAT
EPS
OPM
ROE
P/E
P/BV
EV/Sales
March
(` cr)
(` cr)
(₹)
(%)
(%)
(x)
(x)
(x)
FY2021
8,792
882
59
14.5
18.6
28.6
5.3
2.3
FY2022
12,204
909
61
11.7
16.4
40.2
6.6
2.9
FY2023
14,108
1,270
85
14.0
19.2
40.5
7.8
3.0
Source: Company, Angel Research
Key Financials
Y/E
Sales
PAT
EPS
OPM
ROE
P/E
P/BV
EV/Sales
March
(₹ cr)
(₹ cr)
(₹)
(%)
(%)
(x)
(x)
(x)
FY2021
2,583
(14)
(1)
8.1
-1.3
-
8.9
3.4
FY2022
3,701
342
17
18.6
23.0
39.2
9.0
4.3
FY2023
4,525
606
30
23.1
28.4
30.1
8.6
3.6
Source: Company, Angel Research
14
Diwali Picks Report | November 2023
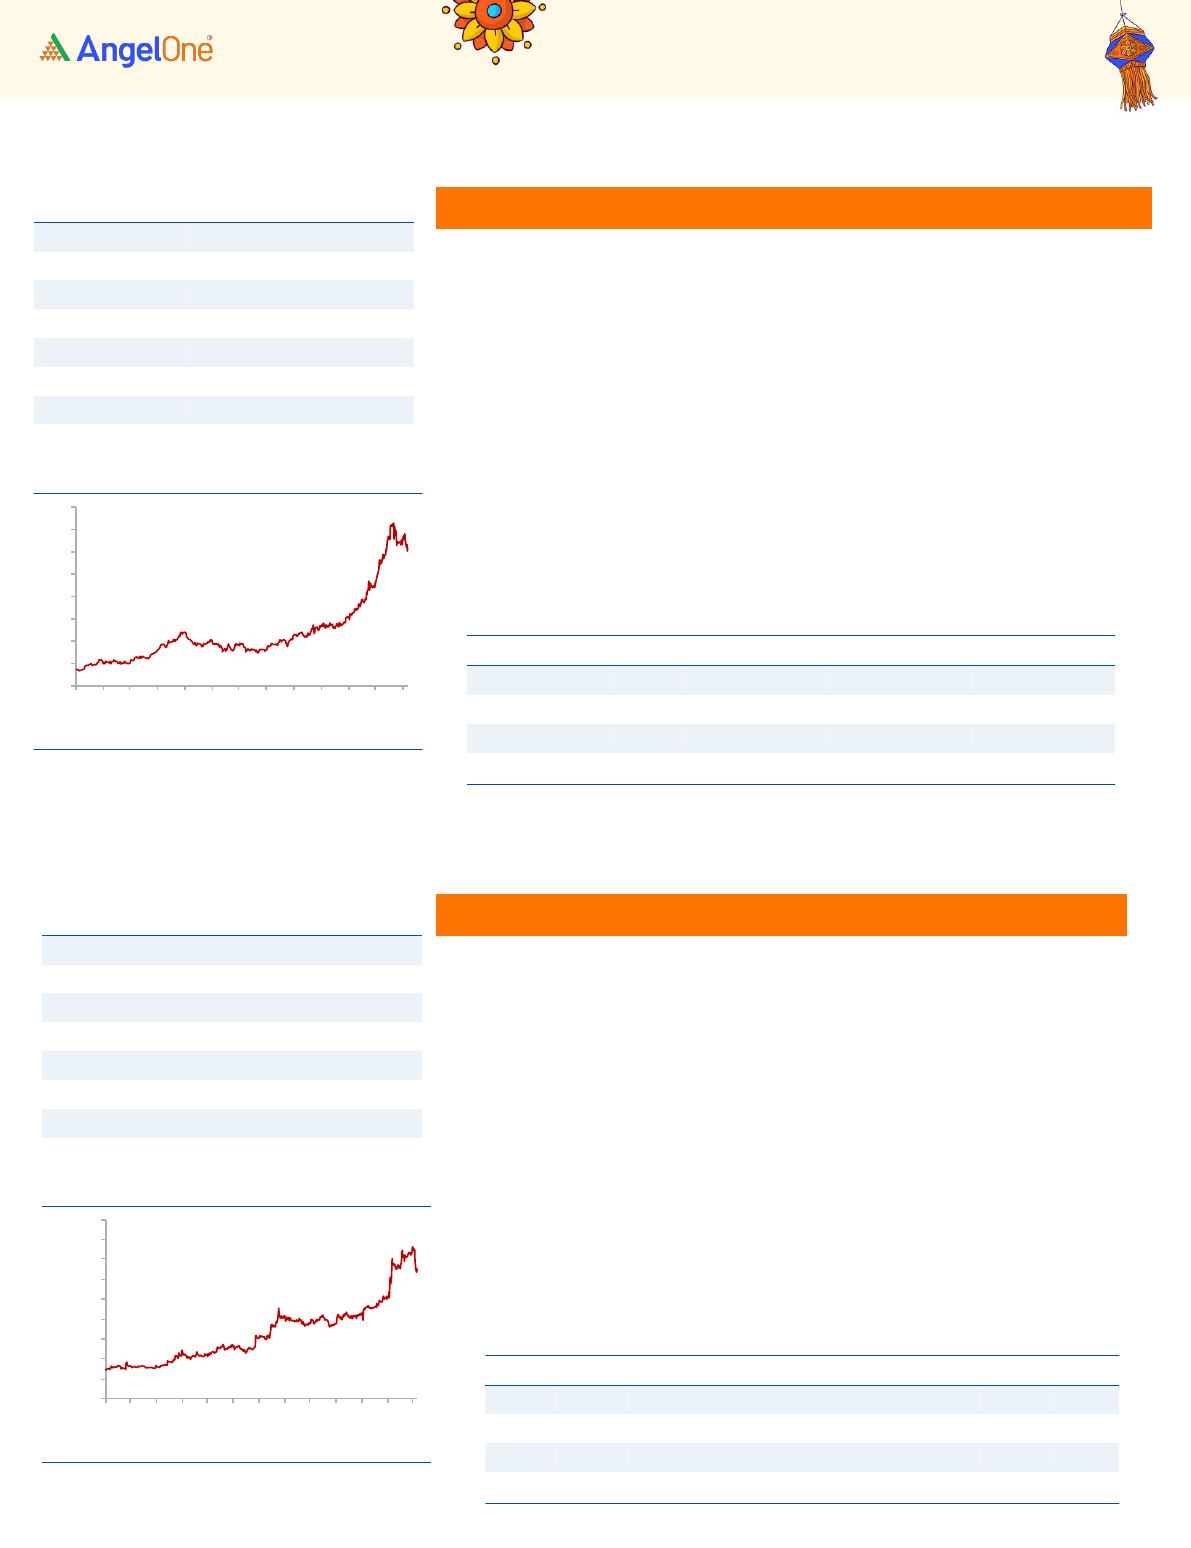
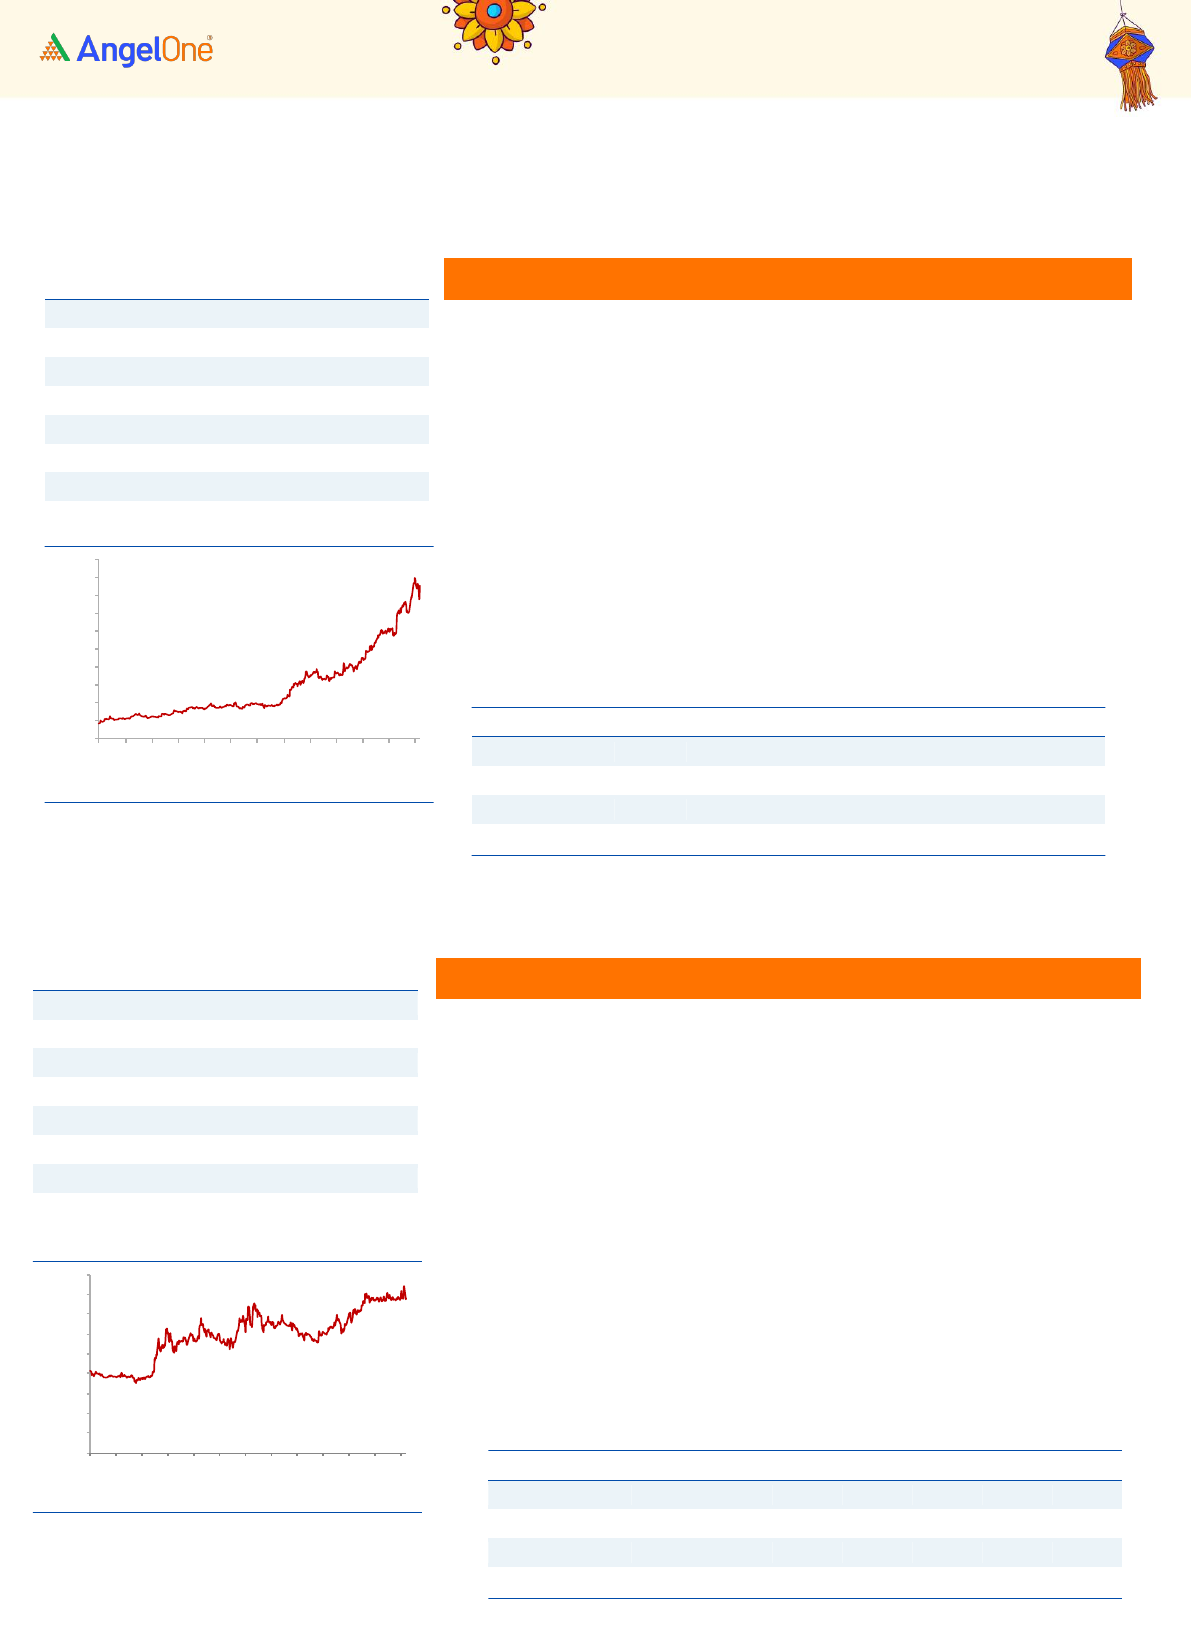
AIA Engineering
AIA Engineering is among the largest manufacturer and supplier of high
chrome wear, corrosion, and abrasion resistant castings. With a strong
international presence, the company generates ~70-80% of its revenue from
exports. It caters to major markets including the UAE, UK, USA, among others.
In Q1FY24, revenue rose by 14.8% on a YoY basis to Rs 1,240 Crores and net
profit rose by 42.9% on a YoY basis to Rs 273 Crores. Growth is supported by
EBITDA margin improvement, favorable product mix, and operational
efficiency
Revenue is likely to be supported by demand in the cement and mining sector.
To capitalize on this increasing demand, the company is undertaking a capex
which will increase its Total Manufacturing Capacity by ~18% from 440,000 TPA
(FY23) to 520,000 TPA (FY25). Additionally, the company is strategically
focusing on value-added products, such as tube mill internals and crusher
parts, which offer higher margins.
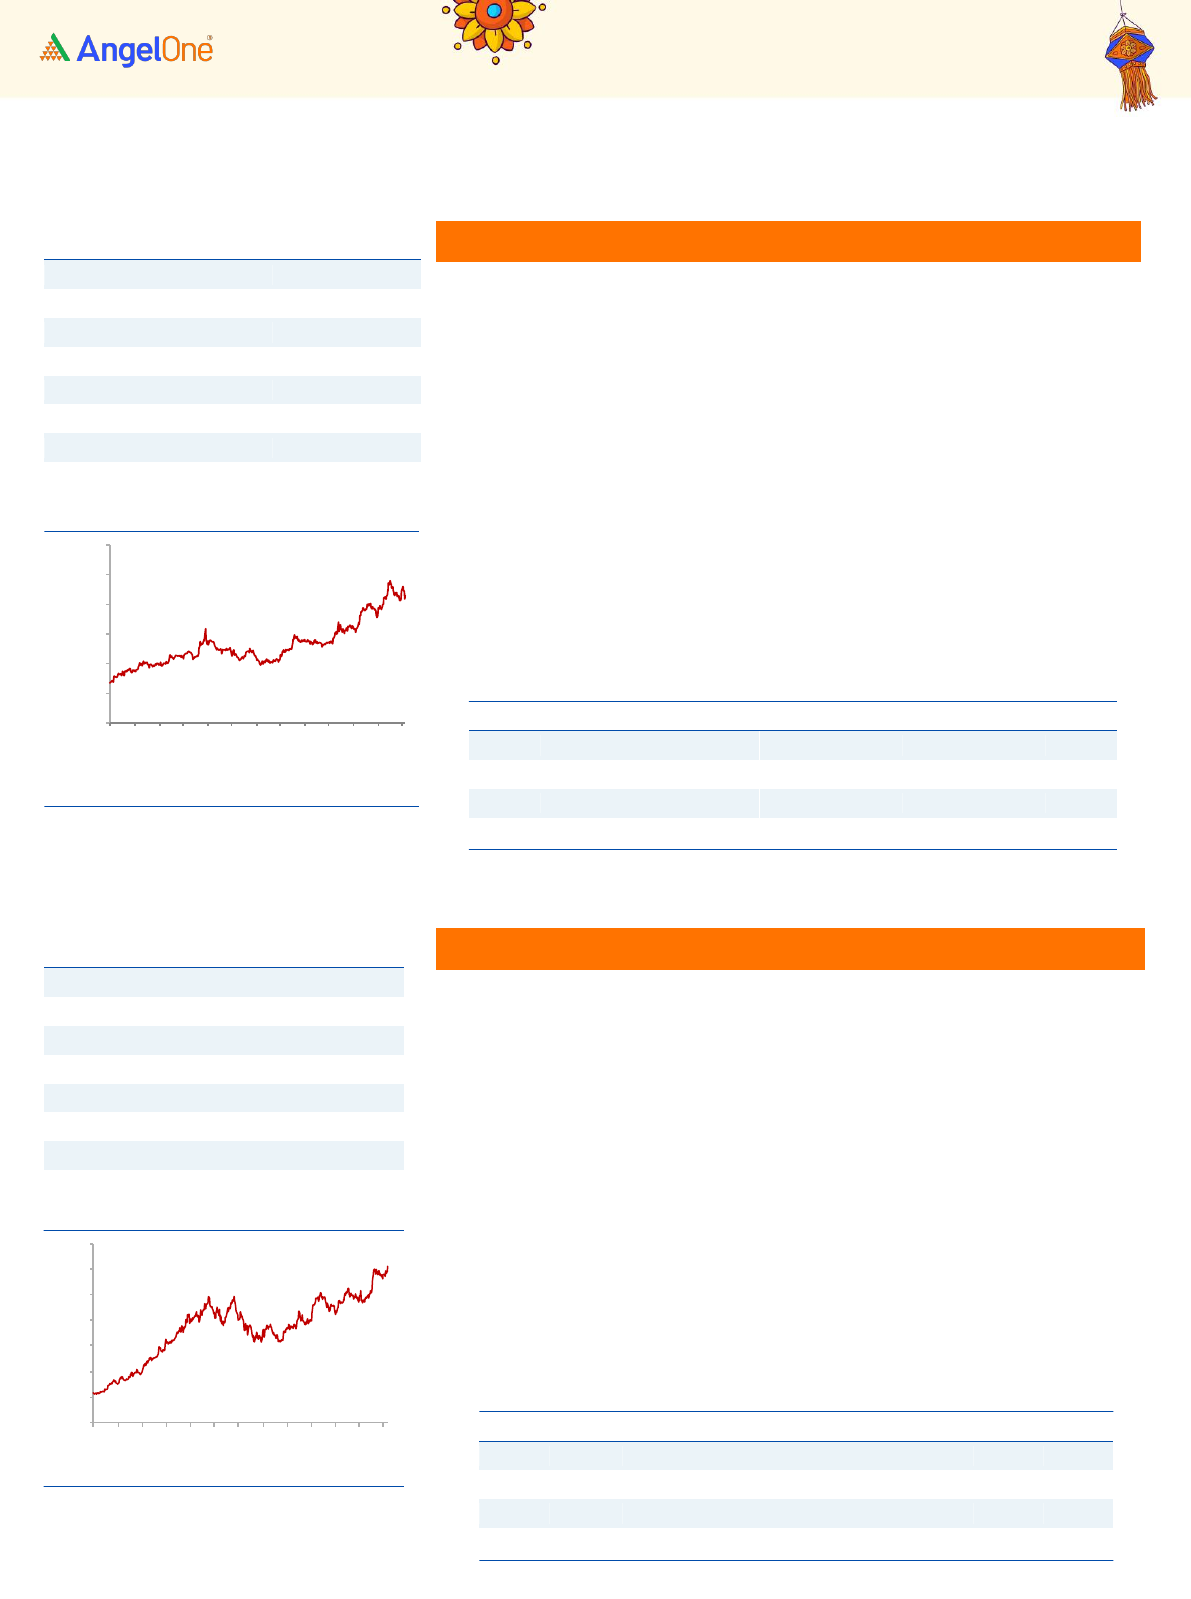
Kirloskar Oil
Kirloskar Oil, a flagship of the Kirloskar Group, is a global leader in generator
sets, specializing in the manufacturing of both air-cooled and water-cooled
engines and diesel generating sets across a wide range of power output from
5kVA – 3000 kVA. Serving diverse sectors like power, agriculture, and various
industrial applications, the company has notable global presence with strong
distribution networks in the Middle East and Africa. They have recently
forayed into the NBFC business.
In Q1FY24, revenue rose by 29.5% on a YoY basis to Rs 1,543 Crores and net
profit rose by 53.7% on a YoY basis to Rs 126 Crores
The surge in power generation sector coupled with growth in roads and the
real estate sector will drive demand for diesel gensets. Increased electricity
access in rural areas will boost demand for electric pumps. The Company is
strategically positioned to capitalize on this. Industrial sales will be driven by
railways, metro projects, roads, etc. Overall, the company is well positioned
to benefit from sector tailwinds such as PLI schemes, government
infrastructure spending, and addressing power deficit.
Stock Info
CMP
3513
TP
4230
Upside
20%
Sector
Capital Goods
Market Cap (`cr)
33,327
Beta
0.4
52 Week High / Low
3825/2385
3-Year-Chart
-
500
1,000
1,500
2,000
2,500
3,000
3,500
4,000
Oct-20
Jan-21
Apr-21
Jul-21
Oct-21
Jan-22
Apr-22
Jul-22
Oct-22
Jan-23
Apr-23
Jul-23
Oct-23
Source: Company, Angel Research
Stock Info
CMP
543
TP
650
Upside
20%
Sector
Capital Goods
Market Cap (`cr)
7,758
Beta
1.0
52 Week High / Low
577/257
3-Year-Chart
-
100
200
300
400
500
600
Oct-20
Jan-21
Apr-21
Jul-21
Oct-21
Jan-22
Apr-22
Jul-22
Oct-22
Jan-23
Apr-23
Jul-23
Oct-23
Source: Company, Angel Research
Key Financials
Y/E
Sales
PAT
EPS
OPM
ROE
P/E
P/BV
EV/Sales
March
(₹ cr)
(₹ cr)
(₹)
(%)
(%)
(x)
(x)
(x)
FY2021
2,881
566
60
28.9
13.3
32.2
4.3
6.5
FY2022
3,567
620
66
24.7
13.0
34.5
4.5
4.2
FY2023
4,909
1,056
112
30.1
18.6
27.3
5.1
5.5
Source: Company, Angel Research
Key Financials
Y/E
Sales
PAT
EPS
OPM
ROE
P/E
P/BV
EV/Sales
March
(₹ cr)
(₹ cr)
(₹)
(%)
(%)
(x)
(x)
(x)
FY2021
3,296
195
13
12.3
10.1
16.7
1.8
1.3
FY2022
4,022
175
12
10.9
8.4
12.8
1.1
1.2
FY2023
5,024
332
23
15.2
14.4
17.7
2.6
1.7
Source: Company, Angel Research
15
Diwali Picks Report | November 2023
Ramkrishna Forgings
RK Forging is the second largest forging player in India and is primarily engaged
in the manufacturing and sale of forged components of automobiles, railway
wagons & coaches, and engineering parts. The company derives ~80% of its
revenue from the Automobile industry.
In Q2FY24, revenue rose by 19.1% on a YoY basis to Rs 981 Crores and net profit
rose 22.4% on a YoY basis to Rs 82 Crores.
The company is expected to benefit from rebound in the Indian automotive cycle
as well as the tailwind from infrastructure capex driven by government
initiatives like Make in India, PLI, development of industrial corridors.
Furthermore, strategic inorganic acquisitions for forward integration and
product diversification are expected to unlock substantial growth potential in
both the domestic and export markets.
Wendt India
Wendt India is JV between 3M India and Carborundum Universal, and is a
leading manufacturer of Super Abrasives, Machining Tools, and Precision
Components. It is a preferred supplier for multiple automotive, auto
components, engineering, aerospace, and defense & ceramics customers.
In Q2FY24, revenue and PAT declined by 2.7% and 10.0% on a YoY basis,
respectively due to lower offtake from some customers due to a slowdown in
the USA, Taiwan, Russia, and Europe.
The Company is actively working on de-risking its Precision component
business to reduce dependence on the Auto Industry. This is being achieved
by exploring new markets in diverse industries like aerospace, Surgical
blades, refrigerators, air conditioning parts, etc. The launch of new products
is likely to support growth and profitability.
Stock Info
CMP
641
TP
780
Upside
22%
Sector
Capital Goods
Market Cap (`cr)
9,872
Beta
1.6
52 Week High / Low
753/216
3-Year-Chart
-
100
200
300
400
500
600
700
800
Oct-20
Jan-21
Apr-21
Jul-21
Oct-21
Jan-22
Apr-22
Jul-22
Oct-22
Jan-23
Apr-23
Jul-23
Oct-23
Source: Company, Angel Research
Stock Info
CMP
12,320
TP
15,480
Upside
26%
Sector
Capital Goods
Market Cap (`cr)
2,607
Beta
0.8
52 Week High / Low
15535/7050
3-Year-Chart
-
2,000
4,000
6,000
8,000
10,000
12,000
14,000
16,000
18,000
Oct-20
Jan-21
Apr-21
Jul-21
Oct-21
Jan-22
Apr-22
Jul-22
Oct-22
Jan-23
Apr-23
Jul-23
Oct-23
Source: Company, Angel Research
Key Financials
Y/E
Sales
PAT
EPS
OPM
ROE
P/E
P/BV
EV/Sales
March
(₹ cr)
(₹ cr)
(₹)
(%)
(%)
(x)
(x)
(x)
FY2021
1,289
21
6
17.8
2.3
100.6
2.4
2.5
FY2022
2,320
198
12
22.4
18.4
13.5
2.5
1.6
FY2023
3,193
248
16
21.9
18.8
25.1
4.7
1.8
Source: Company, Angel Research
Key Financials
Y/E
Sales
PAT
EPS
OPM
ROE
P/E
P/BV
EV/Sales
March
(₹ cr)
(₹ cr)
(₹)
(%)
(%)
(x)
(x)
(x)
FY2021
137
13
64
19.5
8.9
53.4
4.8
4.5
FY2022
179
27
135
25.8
16.7
50.8
8.5
5.5
FY2023
210
40
200
29.3
21.2
46.1
9.8
8.0
Source: Company, Angel Research

16
Diwali Picks Report | November 2023
LTIMindtree
LTIMindtree is an Indian multinational information technology services and
consulting company. The company provides a wide range of IT services such
as application development maintenance (ADM), enterprise solutions,
infrastructure management services, testing, analytics & artificial
intelligence. The Company derives a majority of its revenue from BFSI and
Media & Entertainment industry. The company has a presence in 30+
countries but derives 73.4% of revenue from North America (Q2FY24).
In Q2FY24, revenue increased by 8.2% on a YoY basis to Rs 8,905 Crores, but
profit fell 2.3%YoY to 1162 Cr on account of wage hikes. However, the
company has delivered better than most of its larger Indian IT peers.
LTIMindtree is well positioned to deliver growth in the long term, given its
multiple long-term contracts with the world’s leading brands, robust deal
wins, and superior execution capabilities. Management is guided for high
single-digit to low double-digit growth in FY24 with margin expansion.
However, there is growing concern regarding the economic outlook of major
economies, which presents a potential risk to the company’s growth.
Blue Star
Blue Star is India’s leading air conditioning and commercial refrigeration
company. The Company manufactures air purifiers, air coolers, water
purifiers, cold storage, and specialty products. The Company has three main
segments, a) Electro-Mechanical Projects (EMP) & Commercial air
conditioning (50.3% in FY23), c) Unitary products (45.5% in FY23), and d)
Professional Electronics and Industrial Systems (4.2% in FY23).
In Q2FY24, revenue increased by 19.5% on a YoY basis to Rs 1,890 Crores and
net profit rose 65.1% YoY to Rs 71 Crores. Revenue growth is driven by growth
in EMP business
The air conditioner penetration is less than 10% in India and the company
expects the industry to grow at a CAGR of 20% over the next 2-3 years.
Intense summer conditions, reduction in electricity consumption, and rising
affordability will result in strong demand for air conditioners.
Stock Info
CMP
985
TP
1348
Upside
37%
Sector
IT
Market Cap (₹cr)
266,414
Beta
0.8
52 Week High / Low
1377/944
3-Year-Chart
-
200
400
600
800
1,000
1,200
1,400
1,600
Jul-19
Sep-19
Dec-19
Mar-20
Jun-20
Sep-20
Dec-20
Mar-21
Jun-21
Sep-21
Dec-21
Mar-22
Jun-22
Source: Company, Angel Research
Stock Info
CMP
878
TP
1130
Upside
29%
Sector
Consumer Durables
Market Cap (`cr)
16,628
Beta
0.3
52 Week High / Low
950/553
3-Year-Chart
-
100
200
300
400
500
600
700
800
900
1,000
Oct-20
Jan-21
Apr-21
Jul-21
Oct-21
Jan-22
Apr-22
Jul-22
Oct-22
Jan-23
Apr-23
Jul-23
Oct-23
Source: Company, Angel Research
Stock Info
CMP
5061
TP
6370
Upside
26%
Sector
Information Technology
Market Cap (`cr)
152,977
Beta
1.2
52 Week High / Low
5590/4120
3-Year-Chart
-
1,000
2,000
3,000
4,000
5,000
6,000
7,000
8,000
Oct-20
Jan-21
Apr-21
Jul-21
Oct-21
Jan-22
Apr-22
Jul-22
Oct-22
Jan-23
Apr-23
Jul-23
Oct-23
Source: Company, Angel Research
Key Financials
Y/E
Sales
PAT
EPS
OPM
ROE
P/E
P/BV
EV/Sales
March
(₹ cr)
(₹ cr)
(₹)
(%)
(%)
(x)
(x)
(x)
FY2021
12,370
1,936
111
24.2
26.5
35.6
9.4
5.6
FY2022
26,109
3,948
133
23.0
27.6
32.5
9.6
4.0
FY2023
33,183
4,408
149
20.1
26.6
33.5
8.9
4.2
Source: Company, Angel Research
Key Financials
Y/E
Sales
PAT
EPS
OPM
ROE
P/E
P/BV
EV/Sales
March
(₹ cr)
(₹ cr)
(₹)
(%)
(%)
(x)
(x)
(x)
FY2021
4,264
100
10
7.1
11.3
79.1
9.0
2.2
FY2022
6,064
168
17
6.3
16.5
58.8
9.7
1.7
FY2023
7,977
400
42
8.7
30.1
50.2
10.5
1.7
Source: Company, Angel Research
17
Diwali Picks Report | November 2023
Cera Sanitaryware
Cera Sanitaryware Ltd is engaged in the business of manufacturing and selling
of diverse range of building products. This includes sanitaryware, faucetware,
bath accessories, ceramic tiles & modular kitchens in India. The company has a
strong brand presence in the Indian market and exports its products to over 50
countries. Its product portfolio addresses a wide spectrum of price points,
ranging from mass-market to premium & luxury segments.
In Q1FY24, revenue increased by 7.9% on a YoY basis to Rs 429 Crores and net
profit rose 42.5% YoY to Rs 57 Crores. Margins have improved on the back of
easing prices of raw materials
We expect demand to remain robust from home upgradation and replacement
markets backed by increased home sales. Also, brownfield expansion of the
faucetware facility commenced production in Sep’23, positioning it as a
significant driver of growth. Further, management has stated their guidance of
20% revenue growth in FY24.
Persistent system
Persistent System provides software engineering and strategy services to help
companies implement and modernize their businesses. It has its own software
and frameworks with pre-built integration and acceleration. It also has a
partnership with providers such as Salesforce and AWS.
In Q2FY24, revenue increased by 17.7% on a YoY basis to Rs 2,412 Crores and
net profit increased by 19.6% on a YoY basis to Rs 263 Crores. The company has
delivered strong performance in an environment where execution remains a
challenge. Strong deal wins and a healthy pipeline is the key support against
macro headwinds.
The company is expected to show strong broad-based growth across verticals
backed by strong deal pipeline and better client engagements. Further,
management has guided margin improvements in coming quarters, which is
likely to sustain the growth trajectory.
Stock Info
CMP
6,612
TP
7,700
Upside
25%
Sector
Information Technology
Market Cap (`cr)
46,812
Beta
1.3
52 Week High / Low
6144/3611
3-Year-Chart
-
1,000
2,000
3,000
4,000
5,000
6,000
7,000
Oct-20
Jan-21
Apr-21
Jul-21
Oct-21
Jan-22
Apr-22
Jul-22
Oct-22
Jan-23
Apr-23
Jul-23
Oct-23
Source: Company, Angel Research
Stock Info
CMP
8,481
TP
10,740
Upside
27%
Sector
Consumer Durables
Market Cap (`cr)
11,084
Beta
0.2
52 Week High / Low
9782/4950
3-Year-Chart
-
2,000
4,000
6,000
8,000
10,000
12,000
Oct-20
Jan-21
Apr-21
Jul-21
Oct-21
Jan-22
Apr-22
Jul-22
Oct-22
Jan-23
Apr-23
Jul-23
Oct-23
Source: Company, Angel Research
Key Financials
Y/E
Sales
PAT
EPS
OPM
ROE
P/E
P/BV
EV/Sales
March
(₹ cr)
(₹ cr)
(₹)
(%)
(%)
(x)
(x)
(x)
FY2021
1,224
101
77
15.0
11.3
55.8
6.5
4.2
FY2022
1,446
151
116
17.1
14.9
35.3
5.4
4.5
FY2023
1,804
209
161
17.9
17.9
45.8
8.3
4.6
Source: Company, Angel Research
Key Financials
Y/E
Sales
PAT
EPS
OPM
ROE
P/E
P/BV
EV/Sales
March
(₹ cr)
(₹ cr)
(₹)
(%)
(%)
(x)
(x)
(x)
FY2021
4,188
451
59
18.9
16.1
43.2
7.0
3.4
FY2022
5,711
690
90
19.3
20.5
43.4
8.5
6.3
FY2023
8,351
921
121
18.7
23.2
41.6
9.9
4.2
Source: Company, Angel Research
18
Diwali Picks Report | November 2023
Godfrey Phillips
Godfrey Phillips India Limited (GPIL) is a tobacco company headquartered in
Kolkata, India. GPIL's business is divided into two segments: tobacco (90% in
Q1FY24) and non-tobacco business (10% in Q1FY24). It also has an exclusive
sourcing and supply agreement with Philip Morris International to
manufacture and distribute the renowned Marlboro brand in India.
In Q1 FY24, revenue increased by 26.4% on a YoY basis to Rs 1,046 Crores and
net profit increased by 78.8% YoY to Rs 254 Crores. Topline growth was
supported by a significant increase in exports of unmanufactured tobacco.
Future growth for the company is likely to be driven by targeting new
cigarette markets as they are currently concentrated in Norther & Western
India and focusing on international business by sale of unmanufactured
tobacco. Further, Non-tobacco segment includes 146 convenience stores of
24Seven.
H.G. Infra Engineering
H.G. Infra Engineering is an infrastructure company that provides EPC
(Engineering, Procurement, and Construction) services for road and highway
projects in India. Its project includes the maintenance of roads, bridges,
flyovers, and other infrastructure contract contracts. The company primarily
generates its revenue from road and highway projects from government and
private undertakings.
In Q1FY24, its revenue increased by 22.2% on a YoY basis to Rs 1,351 Crores
and net profit increased by 37.4% on a YoY basis to Rs 150 Crores. The growth
is on the back of strong order book which stands at ~2.5x Order book to bill
ratio
In the Union Budget 2023-24 allocated a substantial increase in Capex for
various sectors, including a 25% boost for the Road, 27% for Jal Jeevna
Mission, and 49% for railways. This has opened up significant opportunities
for companies like HG Infra. Leveraging this, the company is diversifying
beyond road projects to seize these massive opportunities. With a healthy
order book stands healthy of Rs 11,675 Cr (as of Jun’23), comprising 53% from
the EPC projects and 47% from the HAM projects, coupled with a robust
balance sheet with impressive return ratios, HG Infra is well positioned to
maintain its growth momentum.
Stock Info
CMP
2,261
TP
2,700
Upside
19%
Sector
FMCG
Market Cap (`cr)
11,229
Beta
1.4
52 Week High / Low
2357/1462
3-Year-Chart
-
500
1,000
1,500
2,000
2,500
Oct-20
Jan-21
Apr-21
Jul-21
Oct-21
Jan-22
Apr-22
Jul-22
Oct-22
Jan-23
Apr-23
Jul-23
Oct-23
Source: Company, Angel Research
Stock Info
CMP
894
TP
1,190
Upside
33%
Sector
Construction
Market Cap (`cr)
5,882
Beta
1.0
52 Week High / Low
1017/532
3-Year-Chart
-
200
400
600
800
1,000
1,200
Oct-20
Jan-21
Apr-21
Jul-21
Oct-21
Jan-22
Apr-22
Jul-22
Oct-22
Jan-23
Apr-23
Jul-23
Oct-23
Source: Company, Angel Research
Key Financials
Y/E
Sales
PAT
EPS
OPM
ROE
P/E
P/BV
EV/Sales
March
(₹ cr)
(₹ cr)
(₹)
(%)
(%)
(x)
(x)
(x)
FY2021
2,543
377
72
25.9
14.6
14.6
2.0
2.0
FY2022
2,706
438
84
27.6
15.0
13.7
2.1
2.1
FY2023
3,589
690
133
29.4
19.5
13.1
2.6
2.7
Source: Company, Angel Research
Key Financials
Y/E
Sales
PAT
EPS
OPM
ROE
P/E
P/BV
EV/Sales
March
(₹ cr)
(₹ cr)
(₹)
(%)
(%)
(x)
(x)
(x)
FY2021
2,610
237
36
18.8
22.3
10.8
2.4
1.1
FY2022
3,751
380
58
19.1
26.5
9.8
2.6
1.4
FY2023
4,622
493
76
19.8
25.7
12.0
3.1
1.5
Source: Company, Angel Research
19
Diwali Picks Report | November 2023
Safari Inds.
SIL is a manufacturer and marketer of luggage and travel accessories in India.
It has a wide range of products, including hard luggage, soft luggage,
backpacks, and travel accessories.
In Q1FY24, the company reported revenue rose by 45.6% on a YoY basis to Rs
427 Crores and net profit increased by 85.2% on a YoY basis to Rs 50 Crores.
The company has consistently delivered strong performance on the back of
gaining market share.
Safari Industries is poised for a strong performance due to the increasing
advantages of domestic manufacturing, a dip in raw material costs, and a
more stable ocean freight situation. Additionally, their plans to expand
manufacturing capacity and venture into the premium segment in the near
future are anticipated to bolster profitability in the short to long term.
CRISIL
CRISIL, a subsidiary of S&P Global, specializes in offering ratings, research, as
well as risk and policy advisory services to its clients. The company is the
largest credit rating agency in India. Its research business is the highest
contributor to its overall revenue. Moreover, its affiliation with S&P Global
facilitates the integration of local and global perspectives in shaping CRISIL’s
strategy and governance systems.
In Q2CY24, its revenue increased by 15.3% on a YoY basis to Rs 771 Crores and
net profit increased by 10.0% YoY to Rs 151 Crores. Favorable domestic macros
like improving banking credit and corporate bond issuances have resulted in
strong growth.
Favorable domestic demand, an upswing in bond market activities, and the
company's global scalability capabilities all augur well for CRISIL's revenue
growth. With its superior brand, diversified revenue streams, robust
parentage, and impressive return ratios, CRISIL has historically commanded a
premium over its peers, and we anticipate this trend to continue in the future.
Stock Info
CMP
4,140
TP
5,330
Upside
29%
Sector
Consumer Durables
Market Cap (`cr)
10,140
Beta
0.7
52 Week High / Low
4535/1576
3-Year-Chart
-
500
1,000
1,500
2,000
2,500
3,000
3,500
4,000
4,500
5,000
Oct-20
Jan-21
Apr-21
Jul-21
Oct-21
Jan-22
Apr-22
Jul-22
Oct-22
Jan-23
Apr-23
Jul-23
Oct-23
Source: Company, Angel Research
Stock Info
CMP
4,105
TP
4,850
Upside
18%
Sector
Financial Services
Market Cap (`cr)
28,479
Beta
0.3
52 Week High / Low
4283/2712
3-Year-Chart
-
500
1,000
1,500
2,000
2,500
3,000
3,500
4,000
4,500
Oct-20
Jan-21
Apr-21
Jul-21
Oct-21
Jan-22
Apr-22
Jul-22
Oct-22
Jan-23
Apr-23
Jul-23
Oct-23
Source: Company, Angel Research
Key Financials
Y/E
Sales
PAT
EPS
OPM
ROE
P/E
P/BV
EV/Sales
March
(₹cr)
(₹ cr)
(₹)
(%)
(%)
(x)
(x)
(x)
FY2021
328
(21)
(9)
-0.8
-7.5
-
4.9
4.1
FY2022
705
22
10
7.6
7.4
69.4
6.8
3.2
FY2023
1,212
125
53
17.0
29.4
51.7
15.2
4.1
Source: Company, Angel Research
Key Financials
Y/E
Sales
PAT
EPS
OPM
ROE
P/E
P/BV
EV/Sales
March
(₹ cr)
(₹ cr)
(₹)
(%)
(%)
(x)
(x)
(x)
CY2020
1,982
355
49
30.0
27.0
39.9
10.8
6.9
CY2021
2,301
466
64
31.9
29.5
48.9
13.4
5.7
CY2022
2,769
564
77
30.8
31.5
43.8
13.8
8.4
Source: Company, Angel Research
20
Diwali Picks Report | November 2023
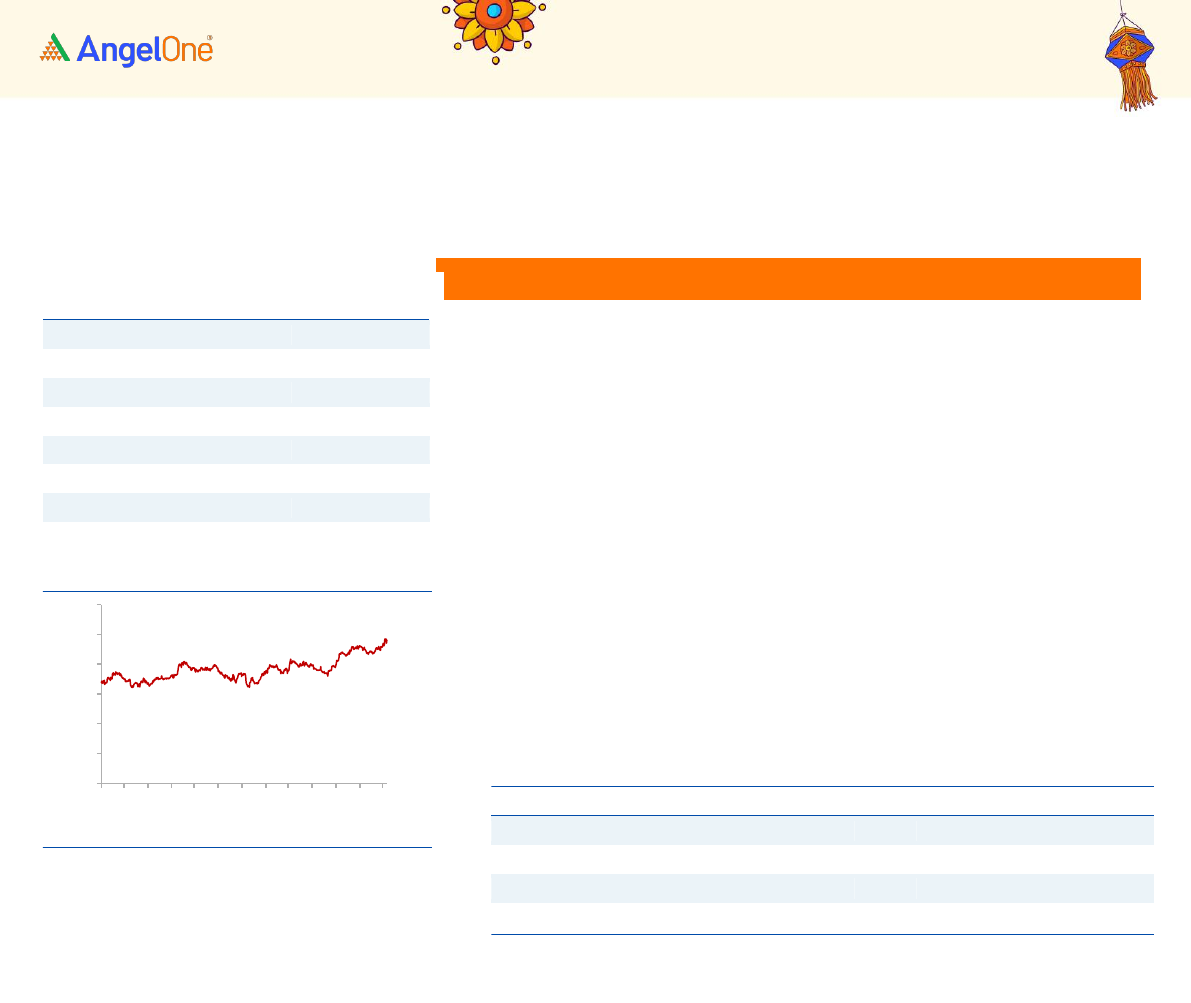
Nestle India
Nestle India is a subsidiary of Nestle which is a Swiss MNC. The company has
established a market position in most of the product categories it has a
presence in. The major product categories are milk products and nutrition
(40.4% of revenue in CY22), beverages (11.4% of revenue in CY22), prepared
dishes and cooking aids (32.2% of revenue in CY22), and chocolate and
confectionery (16.0% of revenue in CY22).
In Q3CY23, its revenue increased by 9.4% YoY to Rs 5,037 Cr and net profit rose
37.4% YoY to Rs 908 Crores. Nestle was able to expand its gross margins in
diary segment and reckon its strong market leadership in Infant Nutrition.
Nestle continues to benefit from distribution expansion, especially in rural
India. The sustainability of the growth trajectory is expected to be driven by
innovation, as well as implementation of higher capex plans in upcoming years,
coupled with increased investments in media. Additionally, focus on
premiumization will also be a crucial driver of growth and profitability
improvement.
Stock Info
CMP
24,239
TP
28,700
Upside
18%
Sector
FMCG
Market Cap (`cr)
231,956
Beta
0.5
52 Week High / Low
24736/17888
3-Year-Chart
-
5,000
10,000
15,000
20,000
25,000
30,000
Oct-20
Jan-21
Apr-21
Jul-21
Oct-21
Jan-22
Apr-22
Jul-22
Oct-22
Jan-23
Apr-23
Jul-23
Oct-23
Source: Company, Angel Research
Key Financials
Y/E
Sales
PAT
EPS
OPM
ROE
P/E
P/BV
EV/Sales
March
(₹ cr)
(₹ cr)
(₹)
(%)
(%)
(x)
(x)
(x)
CY2020
13,350
2,082
216
25.1
103.1
74.5
76.9
12.4
CY2021
14,741
2,118
220
22.7
108.8
88.9
81.4
11.0
CY2022
16,897
2,391
248
21.9
97.2
75.3
73.2
10.9
Source: Company, Angel Research

21
Diwali Picks Report | November 2023
Stock Bought in last six Month
Stock Sold in last six months
Stock
Date
Reco
Price
AIA Engineering
26-Oct-23
BUY
3,385
Polycab India
25-Oct-23
BUY
5,080
Narayana Hrudaya
4-Oct-23
BUY
1,108
LTI Mindtree
14-Sep-23
BUY
5,544
Godfrey Phillips
30-Aug-23
BUY
2,164
Wendt India
30-Aug-23
BUY
13,114
Apollo Tyres
17-Aug-23
BUY
393
Akzo Nobel
17-Aug-23
BUY
2,848
Kirloskar Oil
17-Aug-23
BUY
512
Safari Inds.
11-Aug-23
BUY
3,420
P I Industries
9-Aug-23
BUY
3,835
UTI AMC
8-Aug-23
BUY
771
Blue Star
30-Jun-23
BUY
763
eClerx Services
30-Jun-23
BUY
1,711
Ingersoll-Rand
30-Jun-23
BUY
2,860
Cera Sanitary.
28-Jun-23
BUY
7,696
H.G. Infra Engg.
28-Jun-23
BUY
870
Ramkrishna Forg.
28-Jun-23
BUY
468
CRISIL
26-Jun-23
BUY
3,884
KEI Industries
26-Jun-23
BUY
2,242
Persistent Sys
26-Jun-23
BUY
4,958
Astral
23-Jun-23
BUY
1,929
Britannia Inds.
23-Jun-23
BUY
4,956
Tube Investments
23-Jun-23
BUY
3,336
ITC
21-Jun-23
BUY
451
LTIMindtree
21-Jun-23
BUY
4,992
Nestle India
21-Jun-23
BUY
22,850
Source: Company, Angel Research
Stock
Date
Reco
Price
Akzo Nobel
26-Oct-23
EXIT
2,365
Tube Investments
25-Oct-23
EXIT
2,390
P I Industries
4-Oct-23
EXIT
3,414
Astral
14-Sep-23
EXIT
1,900
Apollo Tyres
30-Aug-23
EXIT
390
ITC
30-Aug-23
EXIT
443
KEI Industries
17-Aug-23
EXIT
2,413
Ingersoll-Rand
17-Aug-23
EXIT
3,022
UTI AMC
17-Aug-23
EXIT
760
eClerx Services
17-Aug-23
EXIT
1,702
LTIMindtree
9-Aug-23
EXIT
5,101
Britannia Inds.
8-Aug-23
EXIT
4,606
Amber Enterp.
30-Jun-23
EXIT
2,262
AU Small Finance
28-Jun-23
EXIT
745
HDFC Bank
28-Jun-23
EXIT
1,676
Sona BLW Precis.
28-Jun-23
EXIT
520
Devyani Intl.
26-Jun-23
EXIT
193
HCL Technologies
26-Jun-23
EXIT
1167
Jubilant Ingrev.
26-Jun-23
EXIT
423
Marico
23-Jun-23
EXIT
523
Oberoi Realty
23-Jun-23
EXIT
987
Sobha
23-Jun-23
EXIT
532
Federal Bank
21-Jun-23
EXIT
124
Stove Kraft
21-Jun-23
EXIT
450
Suprajit Engg.
21-Jun-23
EXIT
395

22
Diwali Picks Report | November 2023
DISCLAIMER
We, Angel One Limited (hereinafter referred to as “Angel”) a company duly incorporated under the provisions of the
Companies Act, 1956 with its registered office at 601, 6th Floor, Ackruti Star, Central Road, MIDC, Andheri East, Mumbai –
400093, CIN: (L67120MH1996PLC101709) and duly registered as a member of National Stock Exchange of India
Limited, Bombay Stock Exchange Limited, Metropolitan Stock Exchange Limited, Multi Commodity Exchange of India Ltd
and National Commodity & Derivatives Exchange Ltd.
Angel One limited is a company engaged in diversified financial services business including securities broking, DP services,
distribution of Mutual Fund products. It is also registered as a Depository Participant with CDSL and Portfolio Manager and
Investment Adviser with SEBI. It also has registration with AMFI as a Mutual Fund Distributor. Angel One Limited is a
registered entity with SEBI for Research Analyst in terms of SEBI (Research Analyst) Regulations, 2014 vide registration
number INH000000164 and also registered with PFRDA as PoP, Registration No.19092018. Angel Group does not have
any joint ventures or associates. Angel One Limited, is the ultimate parent company of the Group. Angel or its associates
has not been debarred/ suspended by SEBI or any other regulatory authority for accessing /dealing in securities Market.
AOL was merged with Angel Global Capital Private Limited and subsequently name of Angel Global Capital Private Limited
was changed to Angel Broking Private Limited (AOL) pursuant to scheme of Amalgamation sanctioned by the Hon'ble High
Court of Judicature at Bombay by Orders passed in Company Petition No 710 of 2011 and the approval granted by the
Registrar of Companies. Further, name of Angel Broking Private Limited again got changed to Angel Broking Limited (AOL)
pursuant to fresh certificate of incorporation issued by Registrar of Companies (ROC) dated June 28, 2018. Further name
of Angel Broking name changed to Angel One Ltd pursuant to fresh certificate of incorporation issued by Registrar of
Companies (ROC) dated 23-09-21.
In case of any grievances please write to: support@angelone.in, Compliance Officer Details: Name: Hiren Thakkar, Tel
No. – 08657864228, Email id - compliance@angelone.in.
Registration granted by SEBI and certification from NISM in no way guarantee performance of the intermediary or provide
any assurance of returns to investors.
This document is solely for the personal information of the recipient, and must not be singularly used as the basis of any
investment decision. Nothing in this document should be construed as investment or financial advice. Each recipient of this
document should make such investigations as they deem necessary to arrive at an independent evaluation of an investment
in the securities of the companies referred to in this document (including the merits and risks involved), and should consult
their own advisors to determine the merits and risks of such an investment.
Angel or its associates or research analyst or his relative may have actual/beneficial ownership of 1% or more in the
securities of the subject company at the end of the month immediately preceding the date of publication of the research
report. Neither Angel or its associates nor Research Analysts or his relative has any material conflict of interest at the time of
publication of research report.
Angel or its associates might have received any compensation from the companies mentioned in the report during the
period preceding twelve months from the date of this report for services in respect of managing or co-managing public
offerings, corporate finance, investment banking or merchant banking, brokerage services or other advisory service in a
merger or specific transaction in the normal course of business. Angel or its associates did not receive any compensation or
other benefits from the companies mentioned in the report or third party in connection with the research report. Neither
research entity nor research analyst has been engaged in market making activity for the subject company.
The information in this document has been printed on the basis of publicly available information, internal data and other
reliable sources believed to be true, but we do not represent that it is accurate or complete and it should not be relied on as
such, as this document is for general guidance only. Angel One Limited or any of its affiliates/ group companies shall not
be in any way responsible for any loss or damage that may arise to any person from any inadvertent error in the
information contained in this report.
Angel One Limited does not warrant the accuracy, adequacy or completeness of the service, information and materials and
expressly disclaims liability for errors or omissions in the service, information and materials. While Angel One Limited
endeavors to update on a reasonable basis the information discussed in this material, there may be regulatory,
compliance, or other reasons that prevent us from doing so.
This document is being supplied to you solely for your information, and its contents, information or data may not be
reproduced, redistributed or passed on, directly or indirectly.

23
Diwali Picks Report | November 2023
Neither Angel One Limited, nor its directors, employees or affiliates shall be liable for any loss or damage that may arise
from or in connection with the use of this information. Angel or its associates or Research Analyst or his relative might have
financial interest in the subject company. Research analyst has not served as an officer, director or employee of the subject
company.
Investment in securities market are subject to market risks. Read all the related documents carefully before investing. Any
communication sent to clients on phone numbers or e-mail ids registered with the Trading Member is meant for client
consumption and such material should not be redistributed.
Brokerage will not exceed SEBI prescribed limit. Any Information provided by us through any medium based on our research
or that of our affiliates or third parties or other external sources is subject to domestic and international market conditions
and we do not guarantee the availability or otherwise of any securities or other instruments and such Information is merely
an estimation of certain investments, and we have not and shall not be deemed to have assumed any responsibility for any
such Information.
You should seek independent professional advice and/or tax advice regarding the suitability of any investment decision
whether based on any Information provided by us through the Site from inhouse research or third party reports or otherwise.
The report and information contained herein is strictly confidential and meant solely for the selected recipient and may not
be altered in any way, transmitted to, copied or distributed, in part or in whole, to any other person or to the media or
reproduced in any form, without prior written consent

24
Diwali Picks Report | November 2023
